MockServer UI
MockServer has a real-time dashboard that gives you full visibility into what MockServer is doing. The following views are available from the navigation bar at the top of the page:
- Get Started — guided first-run view: import an OpenAPI spec, set up a proxy, try a quick-start recipe, or browse the docs
- Dashboard — four panels showing log messages, active expectations, received requests, and proxied requests
- Traffic — every captured request in a master list, with a rich detail pane on the right for LLM and MCP traffic, a Replay button to re-issue a captured request, and a Compare toggle to diff two requests field-by-field
- Trace — related requests grouped into swim-lanes — including LLM agent runs — to follow a multi-step flow end to end, plus a Compare tab for diffing two captured runs side-by-side
- Breakpoints — pause, inspect, and manipulate live stream frames (SSE, gRPC, WebSocket, GraphQL subscription) and request/response exchanges; see Interactive Breakpoints
- Mocks — create or edit expectations of every kind (HTTP, gRPC, DNS, MCP, LLM), import them (OpenAPI, WSDL, HAR, Postman), and insert engine-aware template snippets without writing any code
- Chaos — configure and inject HTTP, gRPC, and TCP faults (chaos experiments) that apply to all forwarded requests to a given upstream host or service. The HTTP fault set covers error responses, dropped connections, latency, body corruption, slow-response chunking, quotas/rate limits, count and time windows, gradual degradation, and a GraphQL error envelope, with a TTL so chaos auto-expires
- Performance — create and run load scenarios: a stage-builder for VU and arrival-rate stages with ramp curves, live run status (current stage, target, active VUs), and a combined toggleable latency/throughput metrics graph
- LLM Optimise — analyse captured LLM traffic for cost, token, latency, and prompt-hygiene opportunities, and export an optimisation brief
- MCP Server Health — per-MCP-server latency and error rate for the MCP servers your proxied tools call, worst-first, so you can see which server is the real bottleneck
- Async — inspect the AsyncAPI broker mock: loaded spec, active channels, and messages recorded from broker subscriptions
- gRPC — list mocked gRPC services and methods loaded from protobuf descriptors, with streaming kind and health serving status
- Library — import expectations, export traffic, and manage cassette files, WASM modules, and gRPC descriptors
- Drift — review mock drift records where stubbed responses diverge from the real upstream
- Verify — assert that MockServer received the requests you expected (a single request a given number of times, or an ordered sequence) without writing test code
- Contract — run an OpenAPI spec's operations against a live service and validate every response against the contract
- SLO — assert service-level objectives (latency percentiles and error rate) against recorded traffic without writing test code
- Cluster — view the state-backend cluster this node participates in: node id, coordinator, and member roles
- Metrics — JVM, request-latency, chaos, expectations-by-type, and MCP-tool-call charts (shown when metrics are enabled)
The dashboard connects to MockServer via WebSocket and updates in real time — any changes to expectations, new requests, or log events appear automatically without refreshing the page.
The UI is available for all versions of MockServer except the deployable WAR.
Launch UI
Browser
Open the dashboard in any browser:
http(s)://<host>:<port>/mockserver/dashboardFor example, if MockServer is running on localhost on port 1080:
http://localhost:1080/mockserver/dashboard
MockServerClient or ClientAndServer
The UI can be opened programmatically using the openUI() method:
The openUI() method pauses for 1 second after launching the browser to allow the UI to start collecting logs. This ensures logs are visible even if MockServer is shutdown quickly by a test shutdown function (After, AfterClass, AfterAll, etc.). The pause period can be configured using openUI(TimeUnit timeUnit, long pause).
To simplify debugging when multiple MockServer instances are created, if the logLevel is set to DEBUG and the launchUIForLogLevelDebug configuration property is enabled (default: false), the ClientAndServer constructor will automatically launch the UI.
Real-Time Updates
The dashboard connects to MockServer via WebSocket and receives updates automatically. The connection status is shown in the title bar as a coloured chip:
- Connected — actively receiving updates
- Connecting — attempting to establish a connection
- Error — connection failed (will auto-retry with exponential backoff)
- Disconnected — not connected to MockServer
Updates are throttled to at most one per second to prevent UI flooding during high-traffic scenarios.
Common Features
These behaviours and controls are shared across the dashboard — the navigation bar, the title-bar tools, and the way items are displayed in every panel. The per-view walkthrough that follows builds on them.
Collapsible Items
All items in every panel are collapsed by default, showing a one-line summary (e.g. method and path for requests, timestamp and type for log entries). Click any row to expand it and see the full JSON details. This keeps the dashboard compact and lets you focus on the items you care about.
Search
Each panel has its own search box that filters items by matching any part of the item's content. For example, searching for POST in the Received Requests panel will show only POST requests. The search covers all fields including headers, paths, and response bodies.
Copy to Clipboard
Hover over any item to reveal a copy button. Clicking it copies the full content of that item to your clipboard as text. For grouped log entries (e.g. FORWARDED_REQUEST), the copy button copies the entire group including all child entries.
Keyboard Shortcuts
| Shortcut | Action |
|---|---|
⌘K / Ctrl+K | Focus the Log Messages search box |
⌘L / Ctrl+L | Reset the server (clear all logs, expectations, and requests) |
Esc | Toggle the Request Filter panel |
Dark and Light Mode
The dashboard defaults to dark mode. Click the sun/moon icon in the title bar to switch between dark and light themes. Your preference is saved in the browser's local storage.
Auto-Scroll
By default, panels auto-scroll to show the most recent items as they arrive. Click the pause/play button in the title bar to toggle auto-scroll.
Clear and Reset
Click the clear icon in the title bar to access three options:
- Clear Server Logs — removes all log messages while keeping expectations and request history
- Clear Server Expectations — removes all active expectations while keeping logs and request history
- Reset Server (all) — clears everything: logs, expectations, received requests, and proxied requests
Menu Bar (left side)
The far left of the menu bar shows the product name and live status indicators (the navigation tabs sit to their right, and the title-bar tools to the far right):
| Item | Description |
|---|---|
| MockServer | The product wordmark — clicking it has no action; it simply marks the dashboard. |
| Connection status | A chip showing the dashboard's WebSocket connection to the server: connected (green), connecting (amber), or disconnected (red). The dashboard reconnects automatically, so a brief connecting/disconnected state during a restart is normal. |
| HTTP/3 (H3) chip | Shown only when HTTP/3 (QUIC) is enabled. Displays the UDP port and the number of active HTTP/3 connections, e.g. H3 :1080 (2). |
Title Bar Tools
The title bar exposes several server tools as icon buttons. Each opens a dialog or control in the dashboard; the linked pages explain the underlying feature in full:
| Tool | Description | Documentation |
|---|---|---|
| Server Clock | Freeze or advance the server's clock to test time-sensitive behaviour | Clock Control |
| Explain Unmatched Requests | Show why a request did not match any expectation (closest-match diff) | Troubleshooting Matching |
| Server Configuration | View and edit configuration properties at runtime | Configuration Properties |
| Operating Mode (SIMULATE / SPY / CAPTURE) | Controls how unmatched requests are handled — return 404, or forward to the real upstream and record | Operating Mode |
Tools Menu
The tools (wrench) icon in the title bar opens a menu of import, mocking, and inspection tools:
| Tool | Description | Documentation |
|---|---|---|
| Import OpenAPI | Generate expectations from an OpenAPI / Swagger specification | Using OpenAPI |
| Import WSDL | Generate expectations from a WSDL (SOAP) document | Generate Expectations From WSDL |
| Pact Contract (export / verify) | Export expectations as a Pact contract, or verify against one | Pact Export |
| Mock OIDC Provider | Mock an OpenID Connect / OAuth2 provider | Mocking OAuth2 / OIDC |
| AsyncAPI Broker Mock | Mock a Kafka / MQTT / AMQP message broker from an AsyncAPI spec | AsyncAPI Messaging |
| Register CRUD Resource | Create a CRUD data store backed by mock expectations | CRUD Data Store |
| Mock File Store | Serve files from a mock file store | File Storage |
| Diff Two Requests | Compare two recorded requests side by side (dashboard-only tool) | — |
Get Started
The Get Started view is the first screen you see when no expectations or traffic have been recorded yet. It presents five action cards covering the key things MockServer does — open any one to jump straight in, or use the navigation tabs above for the full feature set:
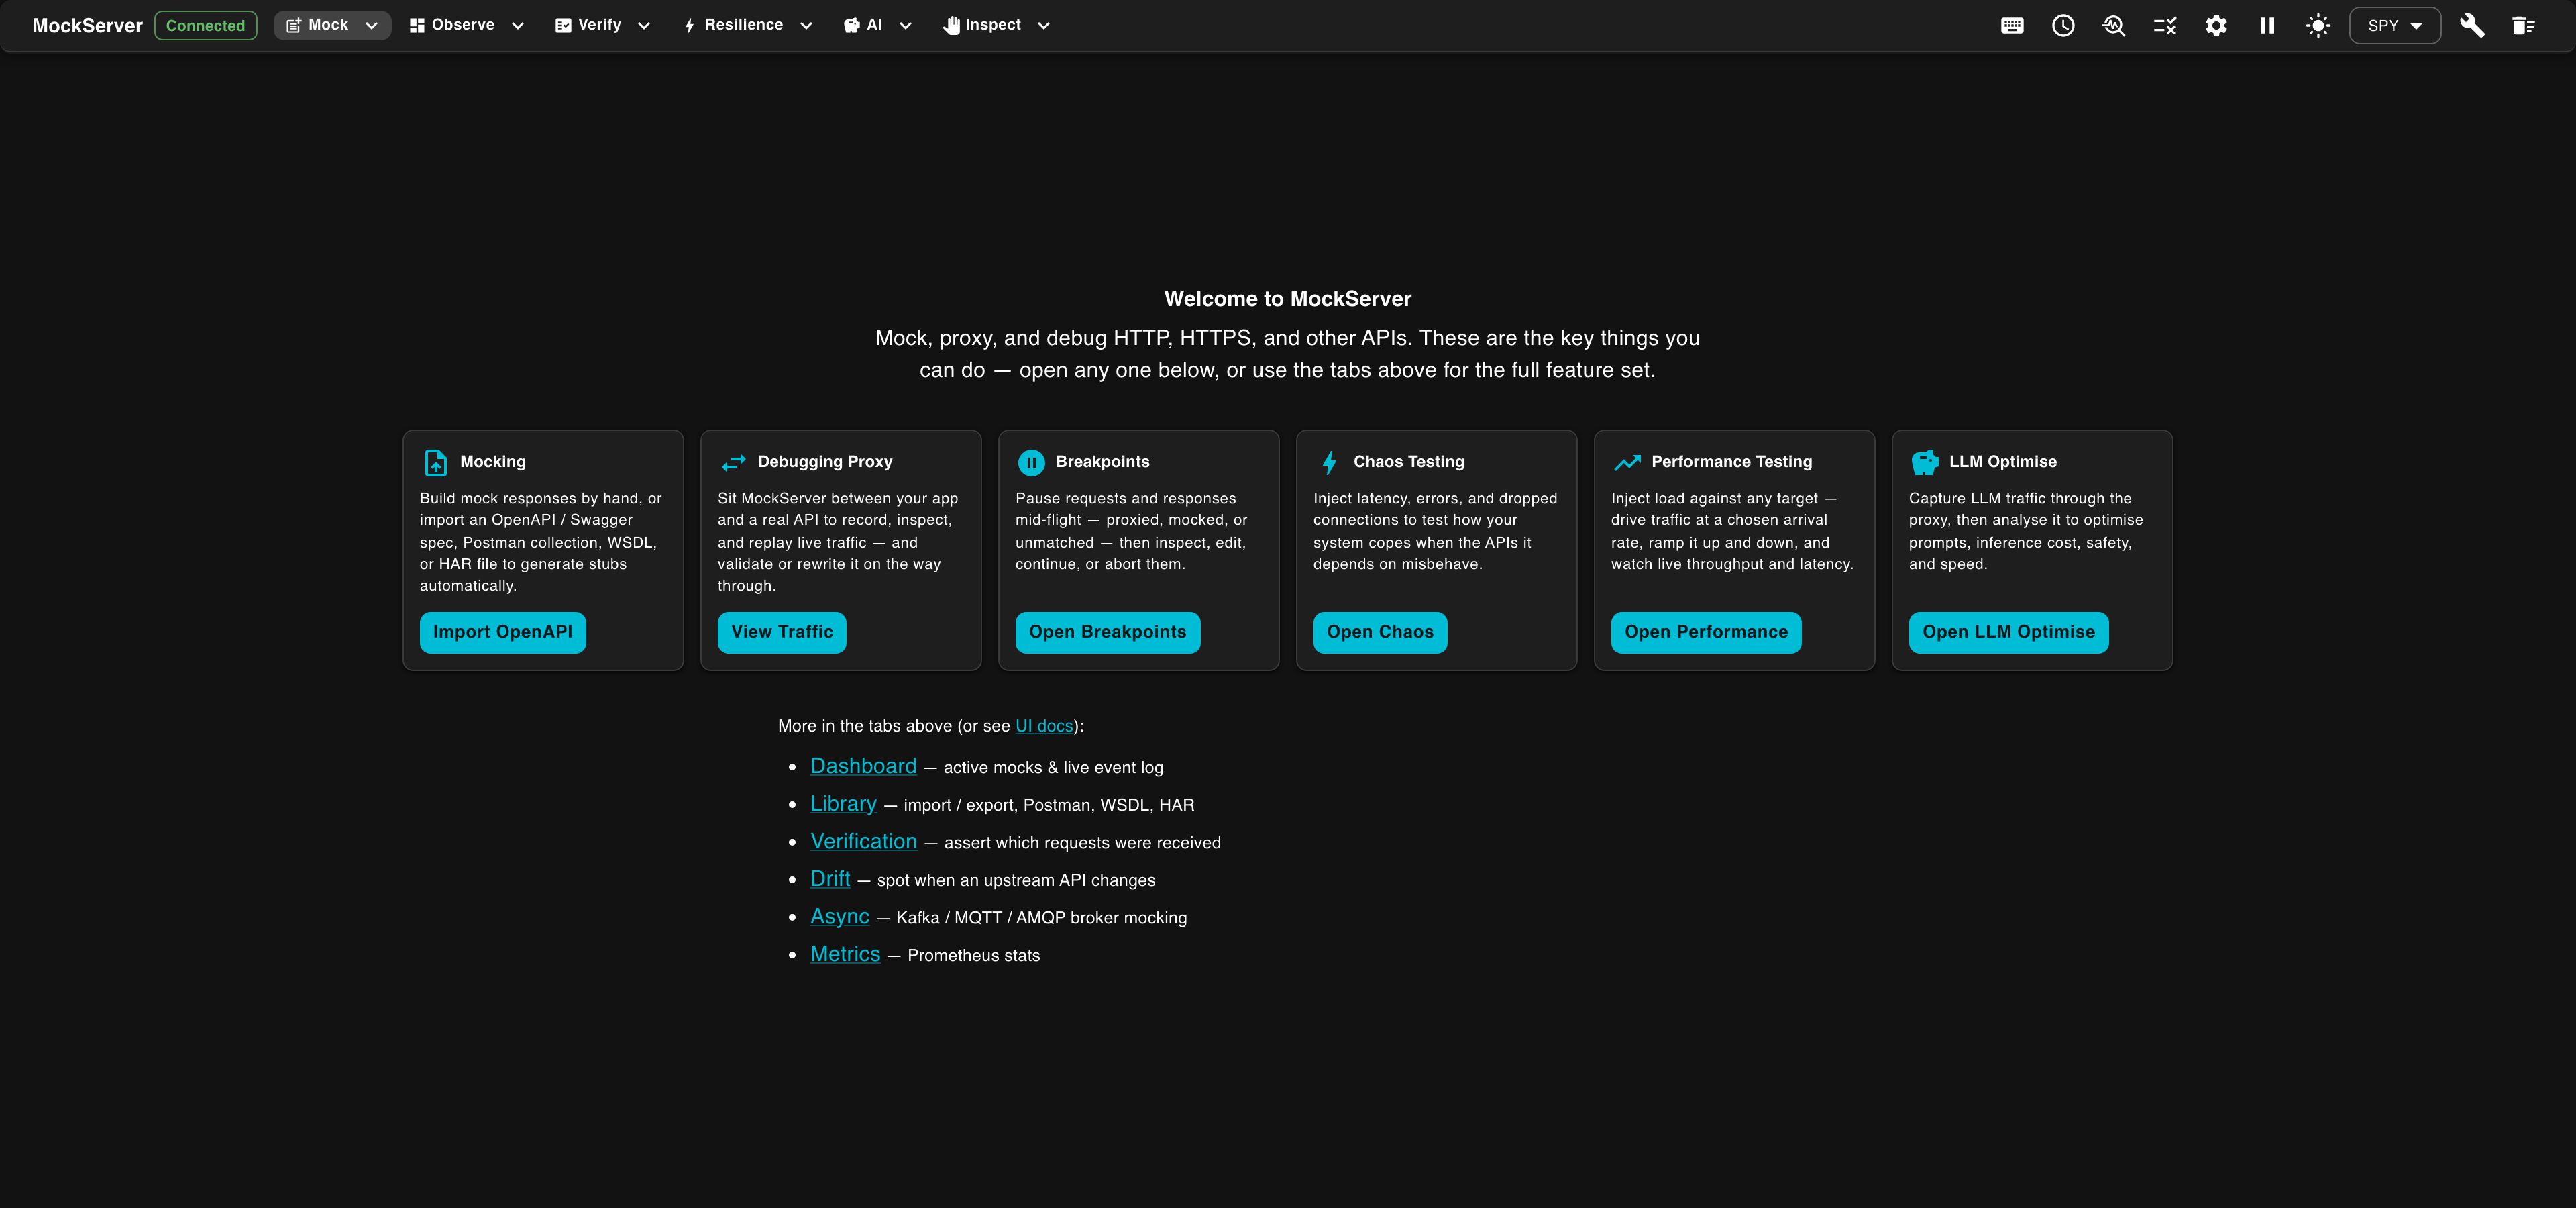
| Card | What it does | Button |
|---|---|---|
| Breakpoints | Pause requests and responses mid-flight — proxied, mocked, or unmatched — then inspect, edit, continue, or abort them. | Opens the Breakpoints view |
| Debugging Proxy | Sit MockServer between your app and a real API to record, inspect, and replay live traffic — and validate or rewrite it on the way through. | Opens the Traffic view |
| LLM / AI Debugging | Mock LLM providers like OpenAI and Anthropic, and inspect agent runs — conversations, tool calls, tokens, and cost — grouped by session. | Opens the Trace view |
| Mocking | Build mock responses by hand, or import an OpenAPI / Swagger spec, Postman collection, WSDL, or HAR file to generate stubs automatically. | Opens the OpenAPI import dialog |
| Chaos Testing | Inject latency, errors, and dropped connections to test how your system copes when the APIs it depends on misbehave. | Opens the Chaos view |
Below the cards, a More in the tabs above list links to the remaining views — Dashboard (active mocks & live event log), Library (import / export, Postman, WSDL, HAR), Verify (assert which requests were received), Drift (spot when an upstream API changes), Async (Kafka / MQTT / AMQP broker mocking), Performance (load scenarios and live metrics graphs), and Metrics (Prometheus stats).
When the first expectation or traffic record arrives, MockServer automatically navigates to the Dashboard view. The Get Started view remains accessible at any time via the Get Started button (rocket icon) in the navigation bar.
Dashboard
The Dashboard view shows four panels in a 2×2 grid:
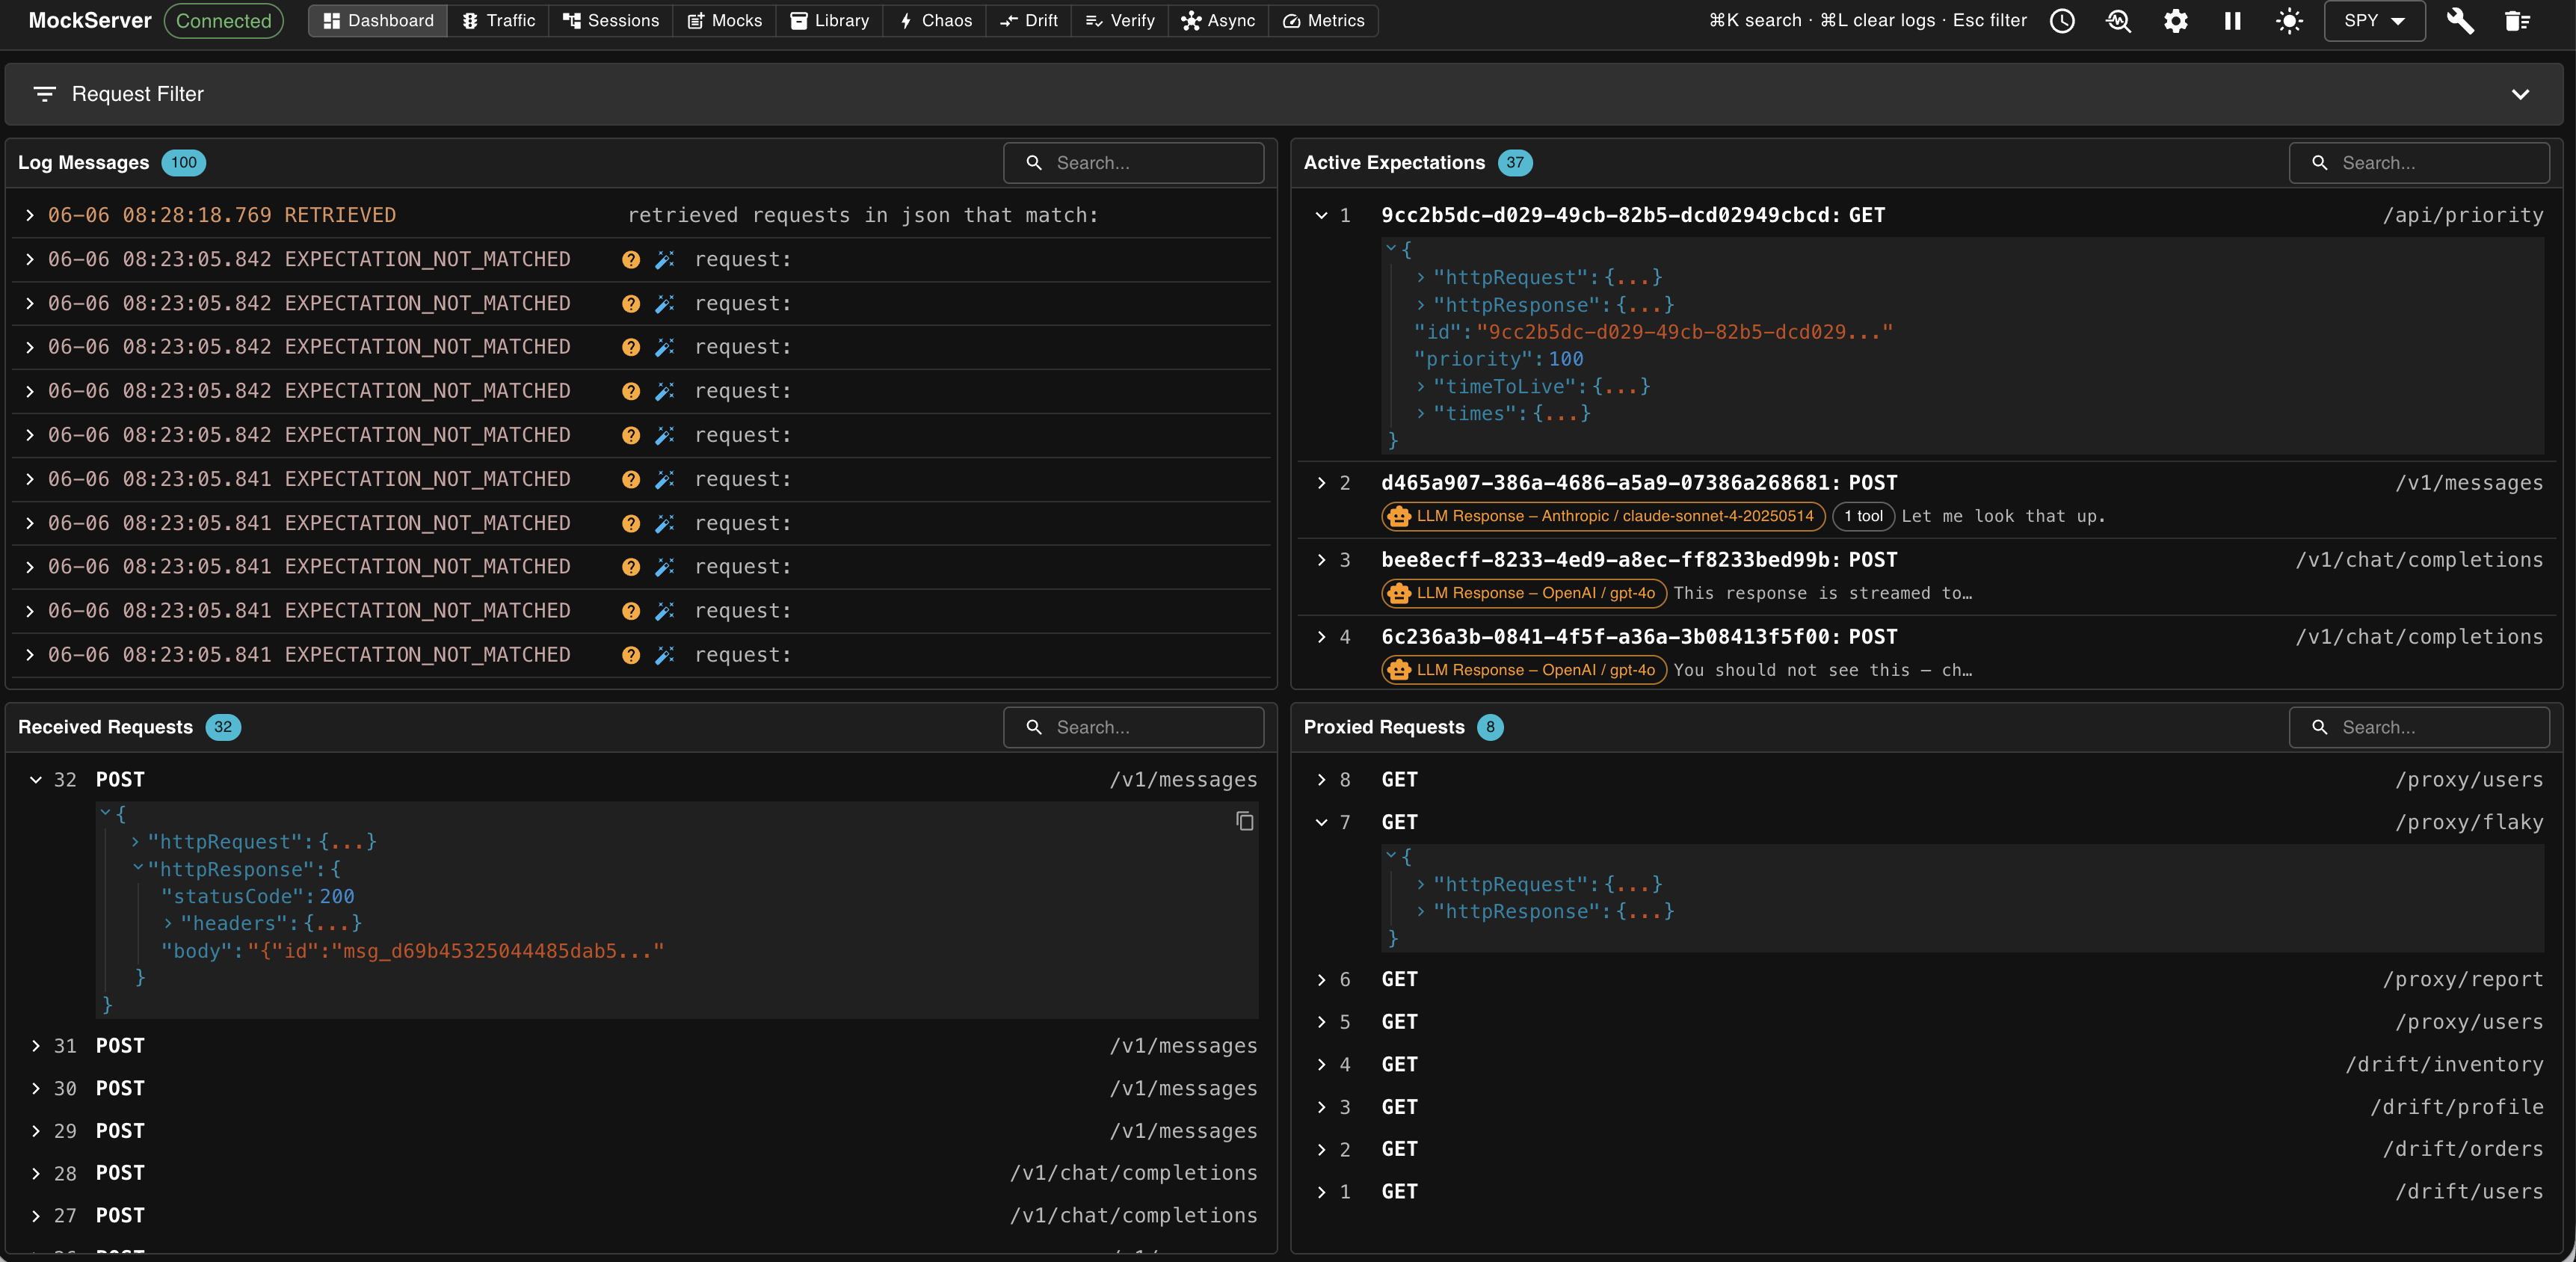
| Area | Description |
|---|---|
| Title Bar | Shows connection status, keyboard shortcuts, and action buttons (auto-scroll, dark/light mode, clear/reset) |
| Request Filter | Collapsible filter panel — filter all panels by HTTP method, path, headers, query parameters, or cookies |
| Log Messages (top-left) | All log events, grouped by request correlation ID, with color-coded types |
| Active Expectations (top-right) | Currently registered expectations in priority order |
| Received Requests (bottom-left) | All HTTP requests received, most recent first, with their matched responses |
| Proxied Requests (bottom-right) | Forwarded requests with their actual responses from destination servers |
For LLM expectations and requests, a second row of chips shows the LLM provider, model name, turn position (e.g. "turn 2 of 3"), and isolation key. Expanding any row shows the full JSON, aligned with the expectation ID column.
Request Filter
The Request Filter panel (toggled with Esc or by clicking the filter icon) appears on the Dashboard, Traffic, and Trace views. It filters all panels by request properties:
- Method — HTTP method (GET, POST, PUT, DELETE, etc.)
- Path — request path (supports exact match)
- Headers — filter by request headers (name/value pairs)
- Query String Parameters — filter by query parameters (name/value pairs)
- Cookies — filter by cookies (name/value pairs)
The filter is sent to the MockServer backend via WebSocket, so filtering happens server-side and only matching data is sent to the browser.
Log Messages
The Log Messages panel lists all log events recorded by MockServer. Events are displayed in reverse chronological order (most recent first) and are color-coded by type:
| Log Type | Meaning |
|---|---|
RECEIVED_REQUEST | An HTTP request was received by MockServer |
EXPECTATION_MATCHED | A request matched an active expectation |
EXPECTATION_NOT_MATCHED | A request did not match an expectation (with a "because" reason) |
EXPECTATION_RESPONSE | A response was returned from a matched expectation |
NO_MATCH_RESPONSE | No expectation matched — a default 404 response was returned |
FORWARDED_REQUEST | A request was forwarded to a destination server (includes the response received) |
CREATED_EXPECTATION | A new expectation was registered |
REMOVED_EXPECTATION | An expectation was removed (expired or explicitly deleted) |
VERIFICATION | A verification request was processed |
VERIFICATION_FAILED | A verification check failed |
INFO / WARN / ERROR | General server log messages |
Related log events (e.g. request received → expectation matched → response sent) are grouped together by correlation ID and displayed with an orange left border. Click the expand button to see all related events within a group.
The because section in EXPECTATION_NOT_MATCHED entries can be expanded to show which properties matched and which did not, making it easy to debug why a request was not matched.
MockServer keeps only a bounded number of recent log events in memory (controlled by maxLogEntries). Once that limit is reached the oldest events are dropped — a common, easy-to-miss cause of "verification intermittently fails" or requests seeming to vanish from the dashboard. When this happens, the Dashboard and Traffic views show a dismissible warning telling you how many events have been dropped; increase maxLogEntries (see also the performance guide) so events are retained. The warning only appears when the server is started with metrics enabled and events are actually being dropped.
Active Expectations
The Active Expectations panel shows all currently active expectations in the order they are applied, taking into account priority, timeToLive, and times. Each expectation is collapsed by default showing its ID, method, and path. Click to expand and see the full expectation definition including request matchers, actions, and timing constraints. Hover a row to edit, duplicate, or delete a single expectation.
To remove several at once, click Select in the panel header to turn on multi-select: tick the checkbox on each expectation you want (or use the header checkbox to select all), then click Delete selected and confirm. Recorded requests and logs are kept.
Received Requests
The Received Requests panel shows all HTTP requests received by MockServer in reverse chronological order (most recent first). This includes requests that matched a mock expectation, requests that were proxied, and requests that received a default 404 response. Each item shows the method and path. Click to expand and see the full request details including headers, query parameters, and body, together with the response that MockServer returned.
Proxied Requests
The Proxied Requests panel shows requests that were forwarded to a destination server along with the actual response received. Each item shows the method and path. Click to expand and see:
- The full request sent to the destination server
- The actual response received from the destination server (status code, headers, and body)
This is useful when using MockServer as a proxy to debug connectivity issues, inspect request/response pairs, or create expectations based on real traffic.
Traffic
The Traffic view is purpose-built for inspecting captured request/response pairs. It covers all captured traffic in one place — both requests that matched a mock expectation and requests that were forwarded to a real upstream. Switch to it using the Traffic button in the navigation bar.
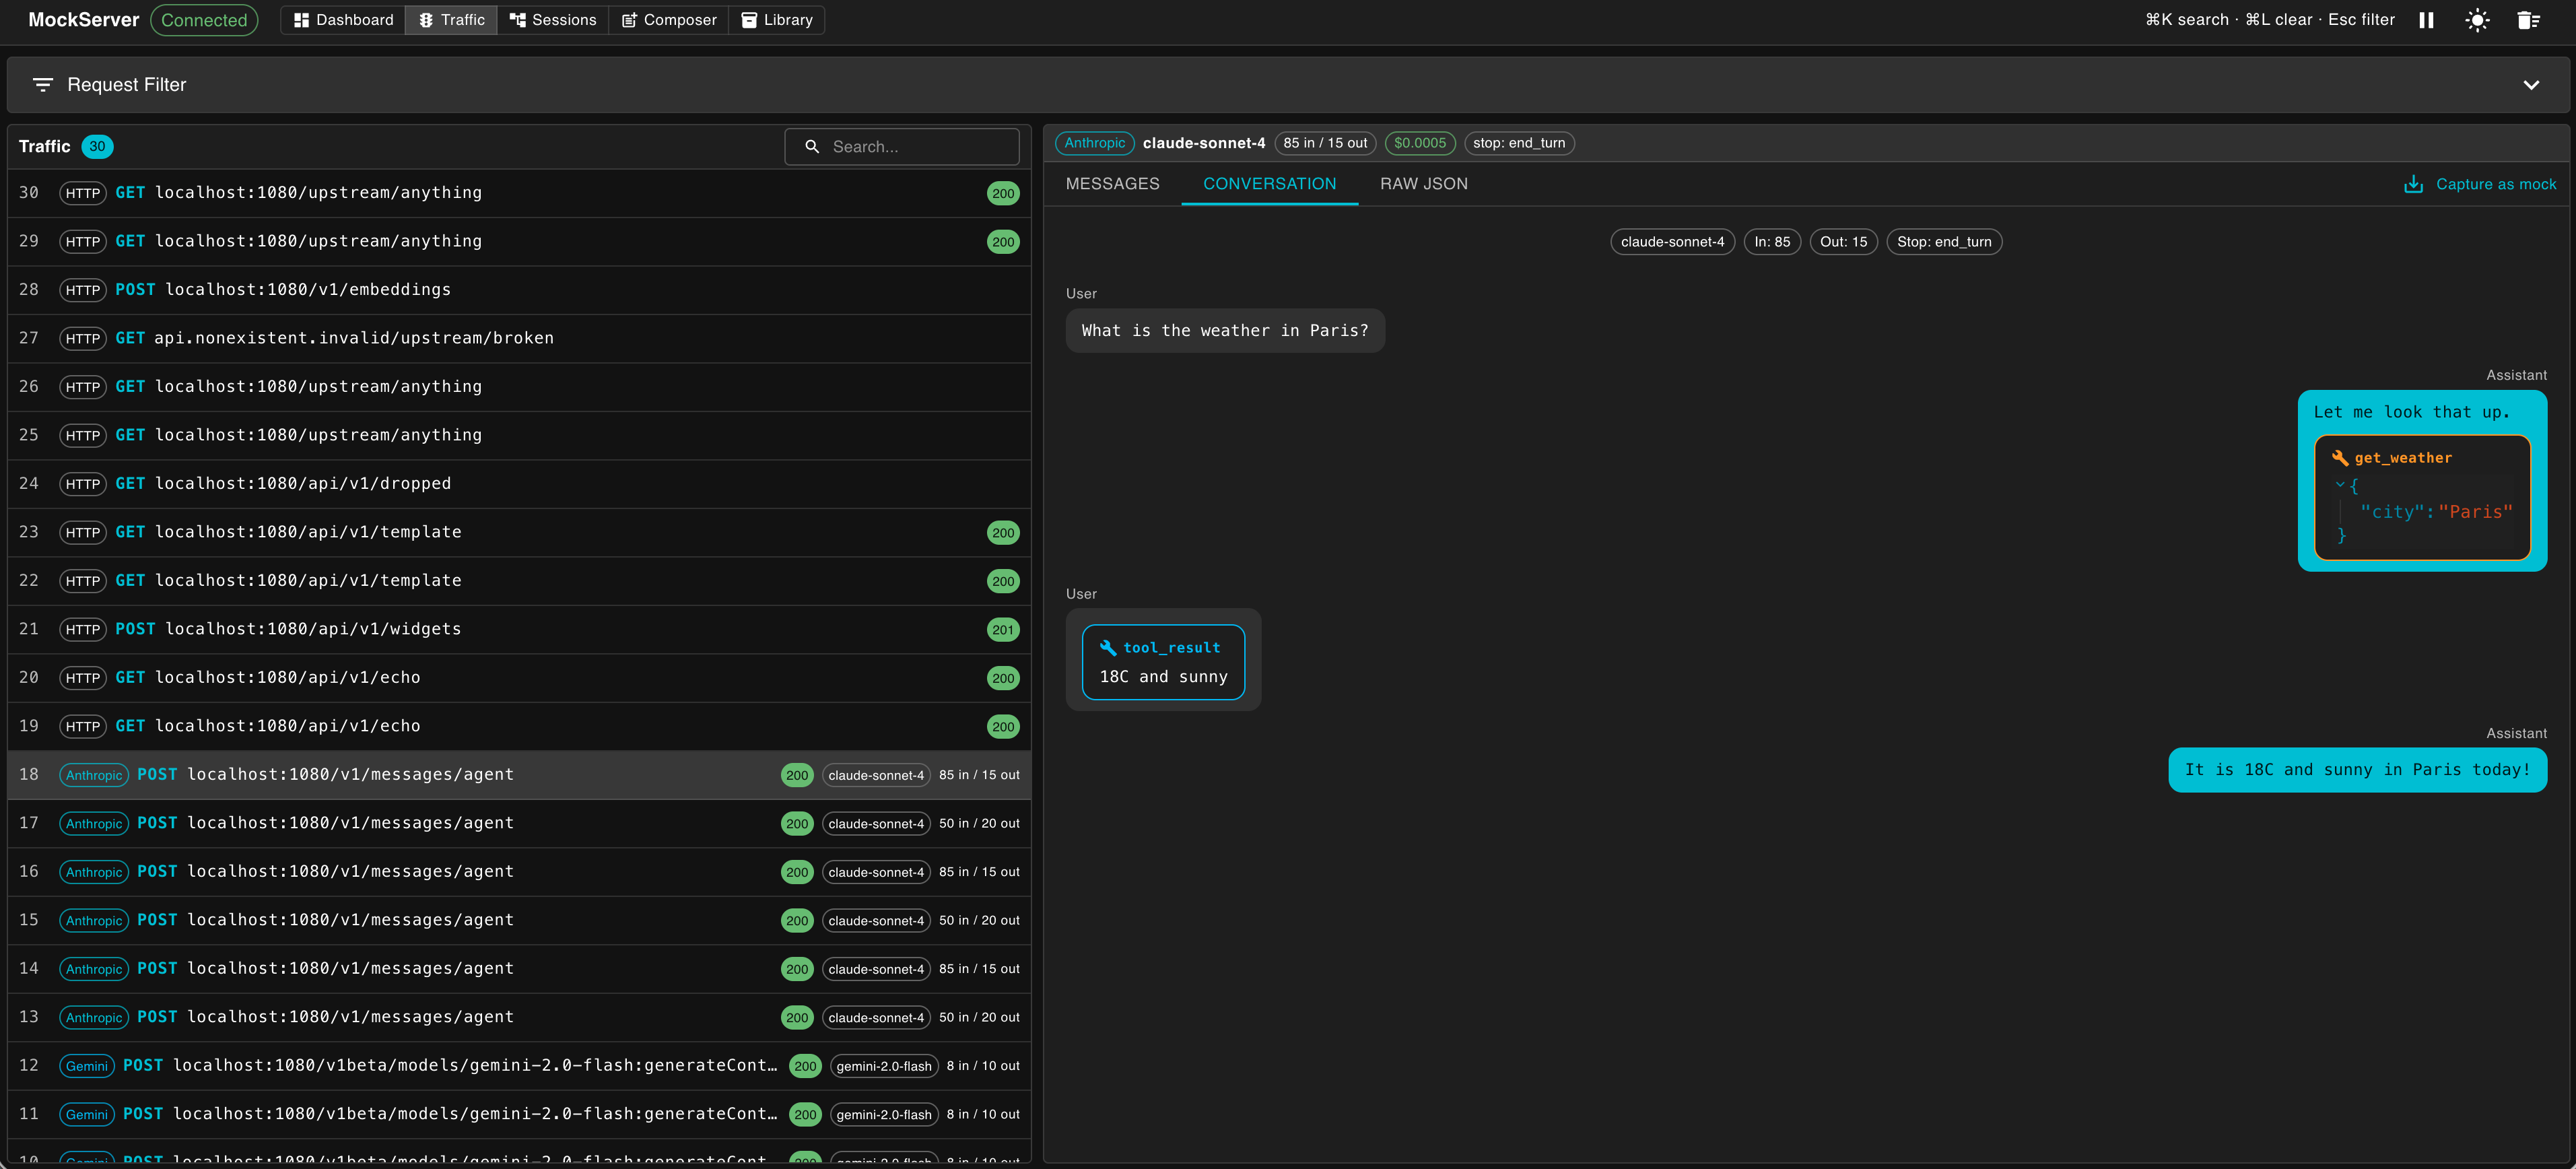
The Traffic view has two areas:
- Master list (left) — one row per request, showing the provider kind (Anthropic, OpenAI, Gemini, Ollama, MCP, HTTP), HTTP method and path, status code, and — for LLM calls — the model name and token counts.
- Detail pane (right) — shown when you click a row in the master list.
The master list header also has a Compare toggle (pick exactly two requests to diff them field-by-field) and a Select toggle for bulk actions: tick any number of rows (or use the header checkbox to select all), then click Clear and confirm to remove those captured requests from the log. Because requests are cleared by matching their shape, identical requests captured alongside a selection may also be removed. Select and Compare are separate modes — turning one on turns the other off.
LLM Usage Strip
For any LLM request, a thin strip appears above the detail tabs showing the provider, model name, token counts (input and output), estimated cost, and stop reason. This lets you see the key usage metrics at a glance without switching tabs.
Detail Tabs by Traffic Kind
| Traffic kind | Available tabs |
|---|---|
| Anthropic, OpenAI, OpenAI Responses, Gemini, or Ollama |
Messages — the request body: system prompt, messages/contents, and tools definition Conversation — chat-transcript view (see below) Scripted Turns — shown when scripted conversation expectations are active; shows the turn predicate and scripted response for each turn SSE Timeline — decoded Server-Sent Events for streamed responses (shown when stream data is present) Raw JSON — the raw request and response JSON |
| MCP JSON-RPC |
MCP — decoded JSON-RPC: method, id, params, and result or error Raw JSON — the raw request and response JSON |
| Any other HTTP traffic | Raw JSON only |
Conversation View
The Conversation tab renders LLM exchanges as a chat transcript. It is available for all five supported LLM providers: Anthropic, OpenAI, OpenAI Responses API, Gemini, and Ollama. User messages are left-aligned and assistant messages are right-aligned, styled as WhatsApp-style chat bubbles. System prompts appear as a distinct banner above the conversation. Tool calls and tool results each appear as their own labelled bubbles.
SSE Timeline
The SSE Timeline tab shows each Server-Sent Event from a streamed LLM response as a separate row. This makes it easy to spot latency spikes within a single response. The final reassembled message is also shown. If the captured body was truncated (because it exceeded maxStreamingCaptureBytes), a banner indicates this.
Capture as Mock
A Capture as mock button appears in the top-right of the detail pane for any LLM-kind request. Clicking it creates a mock expectation directly from the captured traffic — the next matching request will receive the same response without hitting the real API.
Compare Two Requests
The master list toolbar has a Compare toggle for diffing two captured requests field-by-field — useful for spotting why two seemingly similar requests behaved differently (a missing header, a changed query parameter, a different body field).
- Click Compare to enter compare mode. Rows in the master list become selectable.
- Pick exactly two requests. The button next to the toggle shows the running count (Diff (1/2), Diff (2/2)) and only enables once two are selected.
- Click Diff to open the Diff Two Requests dialog. The two selected requests are pre-filled as JSON into the Expected request and Actual request boxes — you can edit either, or hand-author one. Click the dialog's Compare button to run the comparison.
- The result is shown as a table of the fields that differ — Field, Expected, Actual, and a Type chip (
ADDED,REMOVED, orCHANGED) — with a count of the differences. When the two requests match, it reports that they are identical.
Click Compare again to leave compare mode and clear the selection. The diff is computed server-side via the PUT /mockserver/diff endpoint, which takes an expected and an actual request and returns the field-level differences, so the dashboard shows exactly what the server sees.
Request Replay
A Replay button appears in the top-right of the detail pane for any captured request. It re-issues that request to its original target and displays the upstream response — useful for checking whether an upstream has changed, or for comparing what a real upstream returns against what a mock returns.
- Select any captured request in the master list to open its detail pane.
- Click the Replay button in the detail pane header. A dialog opens showing the request that will be replayed.
- Click Replay in the dialog. MockServer sends the captured
httpRequestto its original target viaPUT /mockserver/replayand displays the upstream response as JSON. - Click Replay Again to re-issue the same request without closing the dialog.
SSRF protection: replay uses the same host-allowlist policy as forward expectations. Requests targeting loopback addresses, private RFC-1918 ranges, or hosts not on the configured allowlist are blocked by the server. If a replay is blocked, the dialog shows the SSRF-policy error returned by the server.
Size limit: response bodies exceeding 10 MB are not returned via the control plane. If the upstream response is larger, the server returns an error message explaining the cap; the upstream call was still made.
Replay is distinct from cassette replay (which loads saved expectations from a file) — it re-issues a single captured request to a live upstream and shows the live response.
Trace
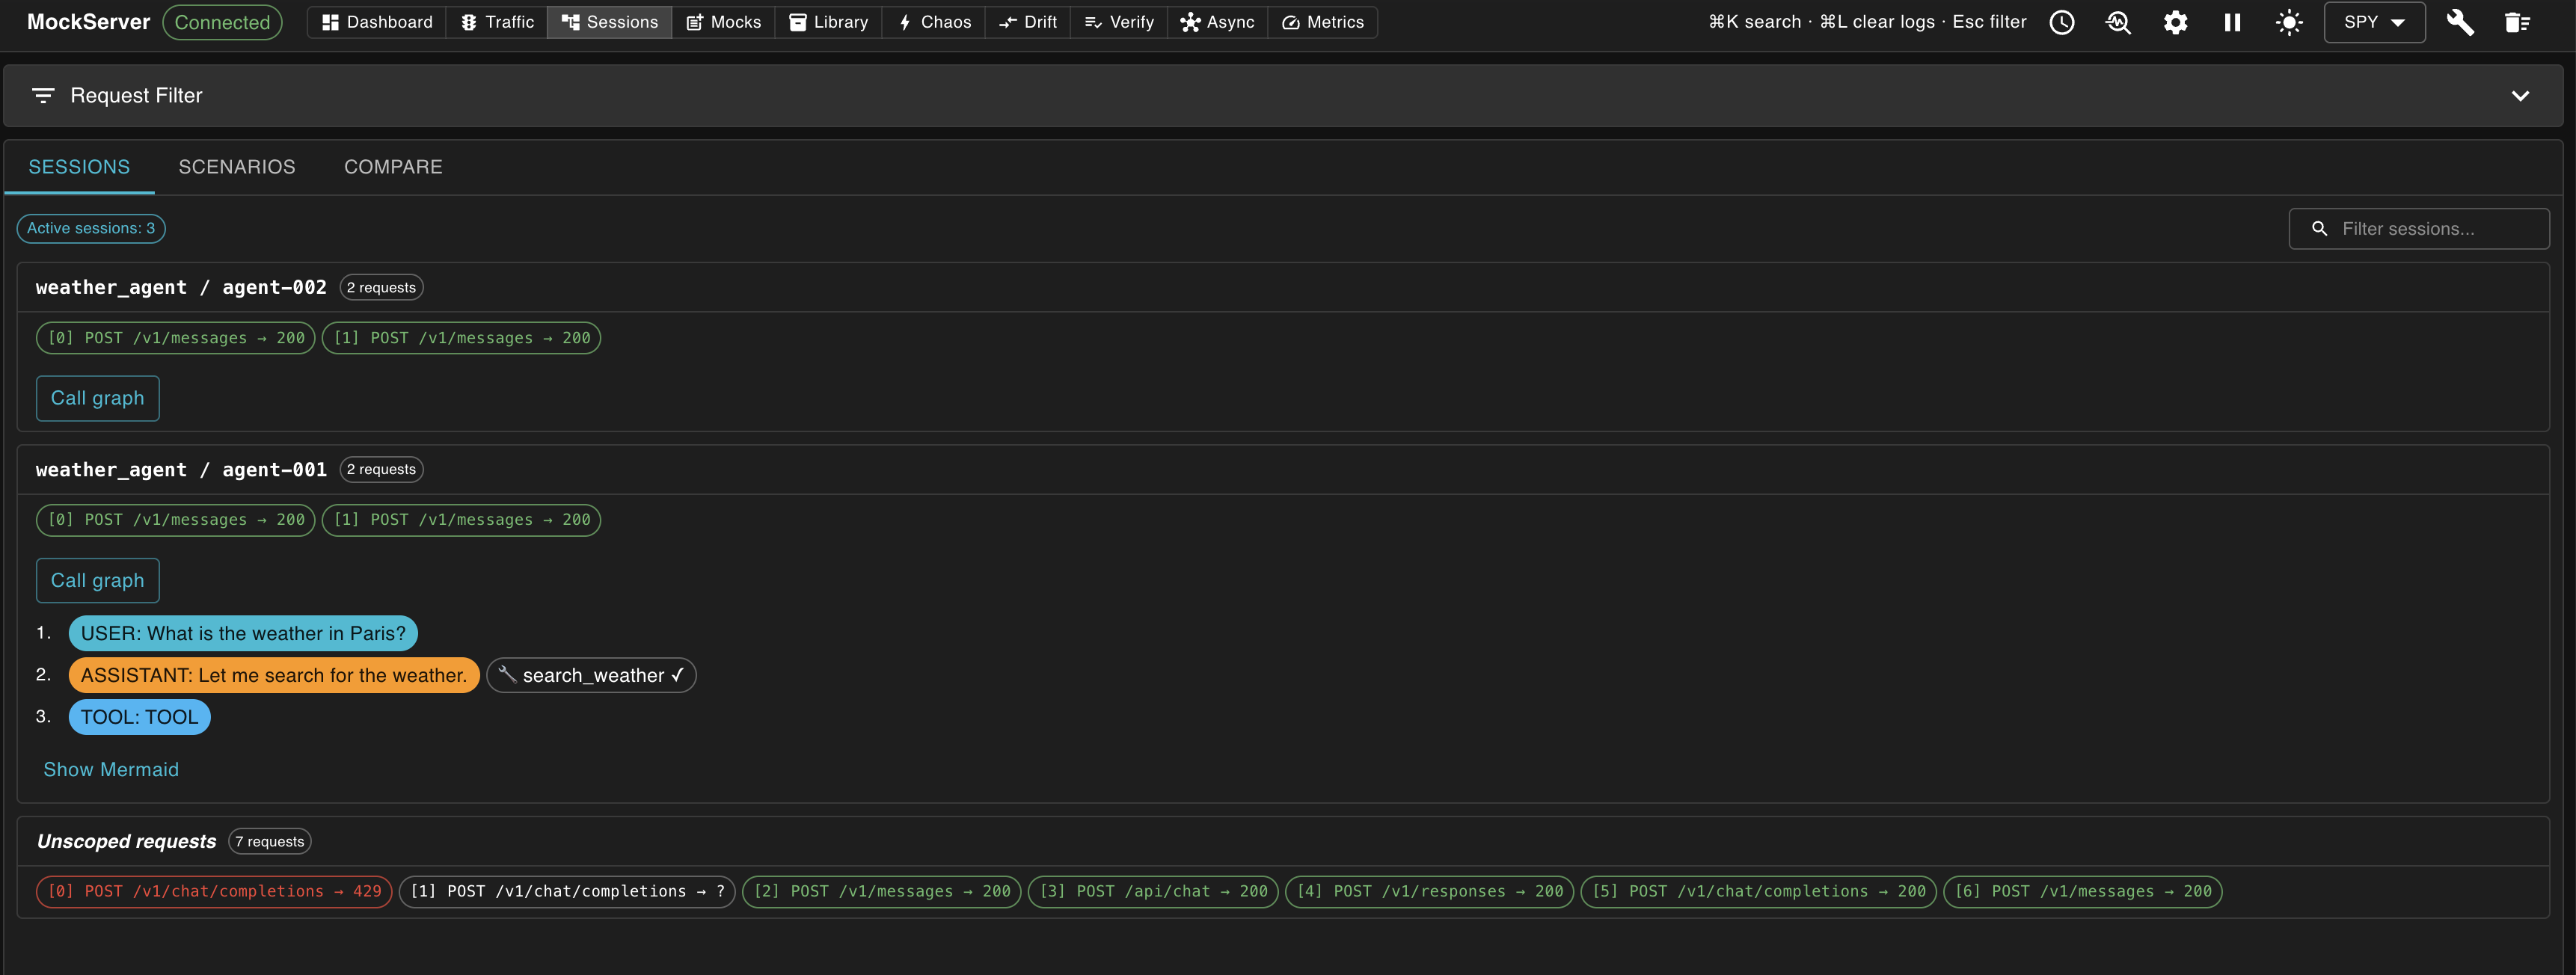
The Trace view groups related requests together — including LLM agent runs — so you can follow a multi-step flow end to end. It organises captured LLM traffic into swim-lanes grouped by isolated conversation session, and has two tabs: Traces and Compare.
On the Traces tab, each swim-lane is labelled <scenarioName> / <isolation-value> (for example, weather-agent / agent-A) and shows chips for each captured turn. Click a chip to open the conversation view for that turn directly below the swim-lane.
The scenario name is the conversation name you supplied (or that MockServer auto-generated) when you registered the LLM conversation mock. The isolation value is the specific header, query parameter, or cookie value that identifies this session within the scenario — for example, the value of the x-session-id request header.
An Unscoped requests strip at the bottom holds requests that did not match any isolated scenario — for example, requests made outside a scripted conversation or without an isolation header.
Trace is most useful when you have set up LLM conversation mocks with per-session isolation. Each unique session identifier (header, query parameter, or cookie value) gets its own swim-lane, so you can trace multiple concurrent test sessions independently.
Compare
The Trace view's second tab, Compare, compares two captured conversation runs side-by-side. Pick Run A and Run B from the available sessions and the view shows a structural trajectory diff: the tool-call chain for each run and a per-turn token usage table. This makes it easy to spot regressions in agent behaviour between test runs.
Breakpoints
The Breakpoints view is the dashboard control panel for Interactive Breakpoints — the ability to pause live HTTP exchanges and streaming frames mid-flight, inspect them, and decide how to continue. Breakpoints are activated by registering a request matcher via PUT /mockserver/breakpoint/matcher; the view shows no active matchers when none are registered.
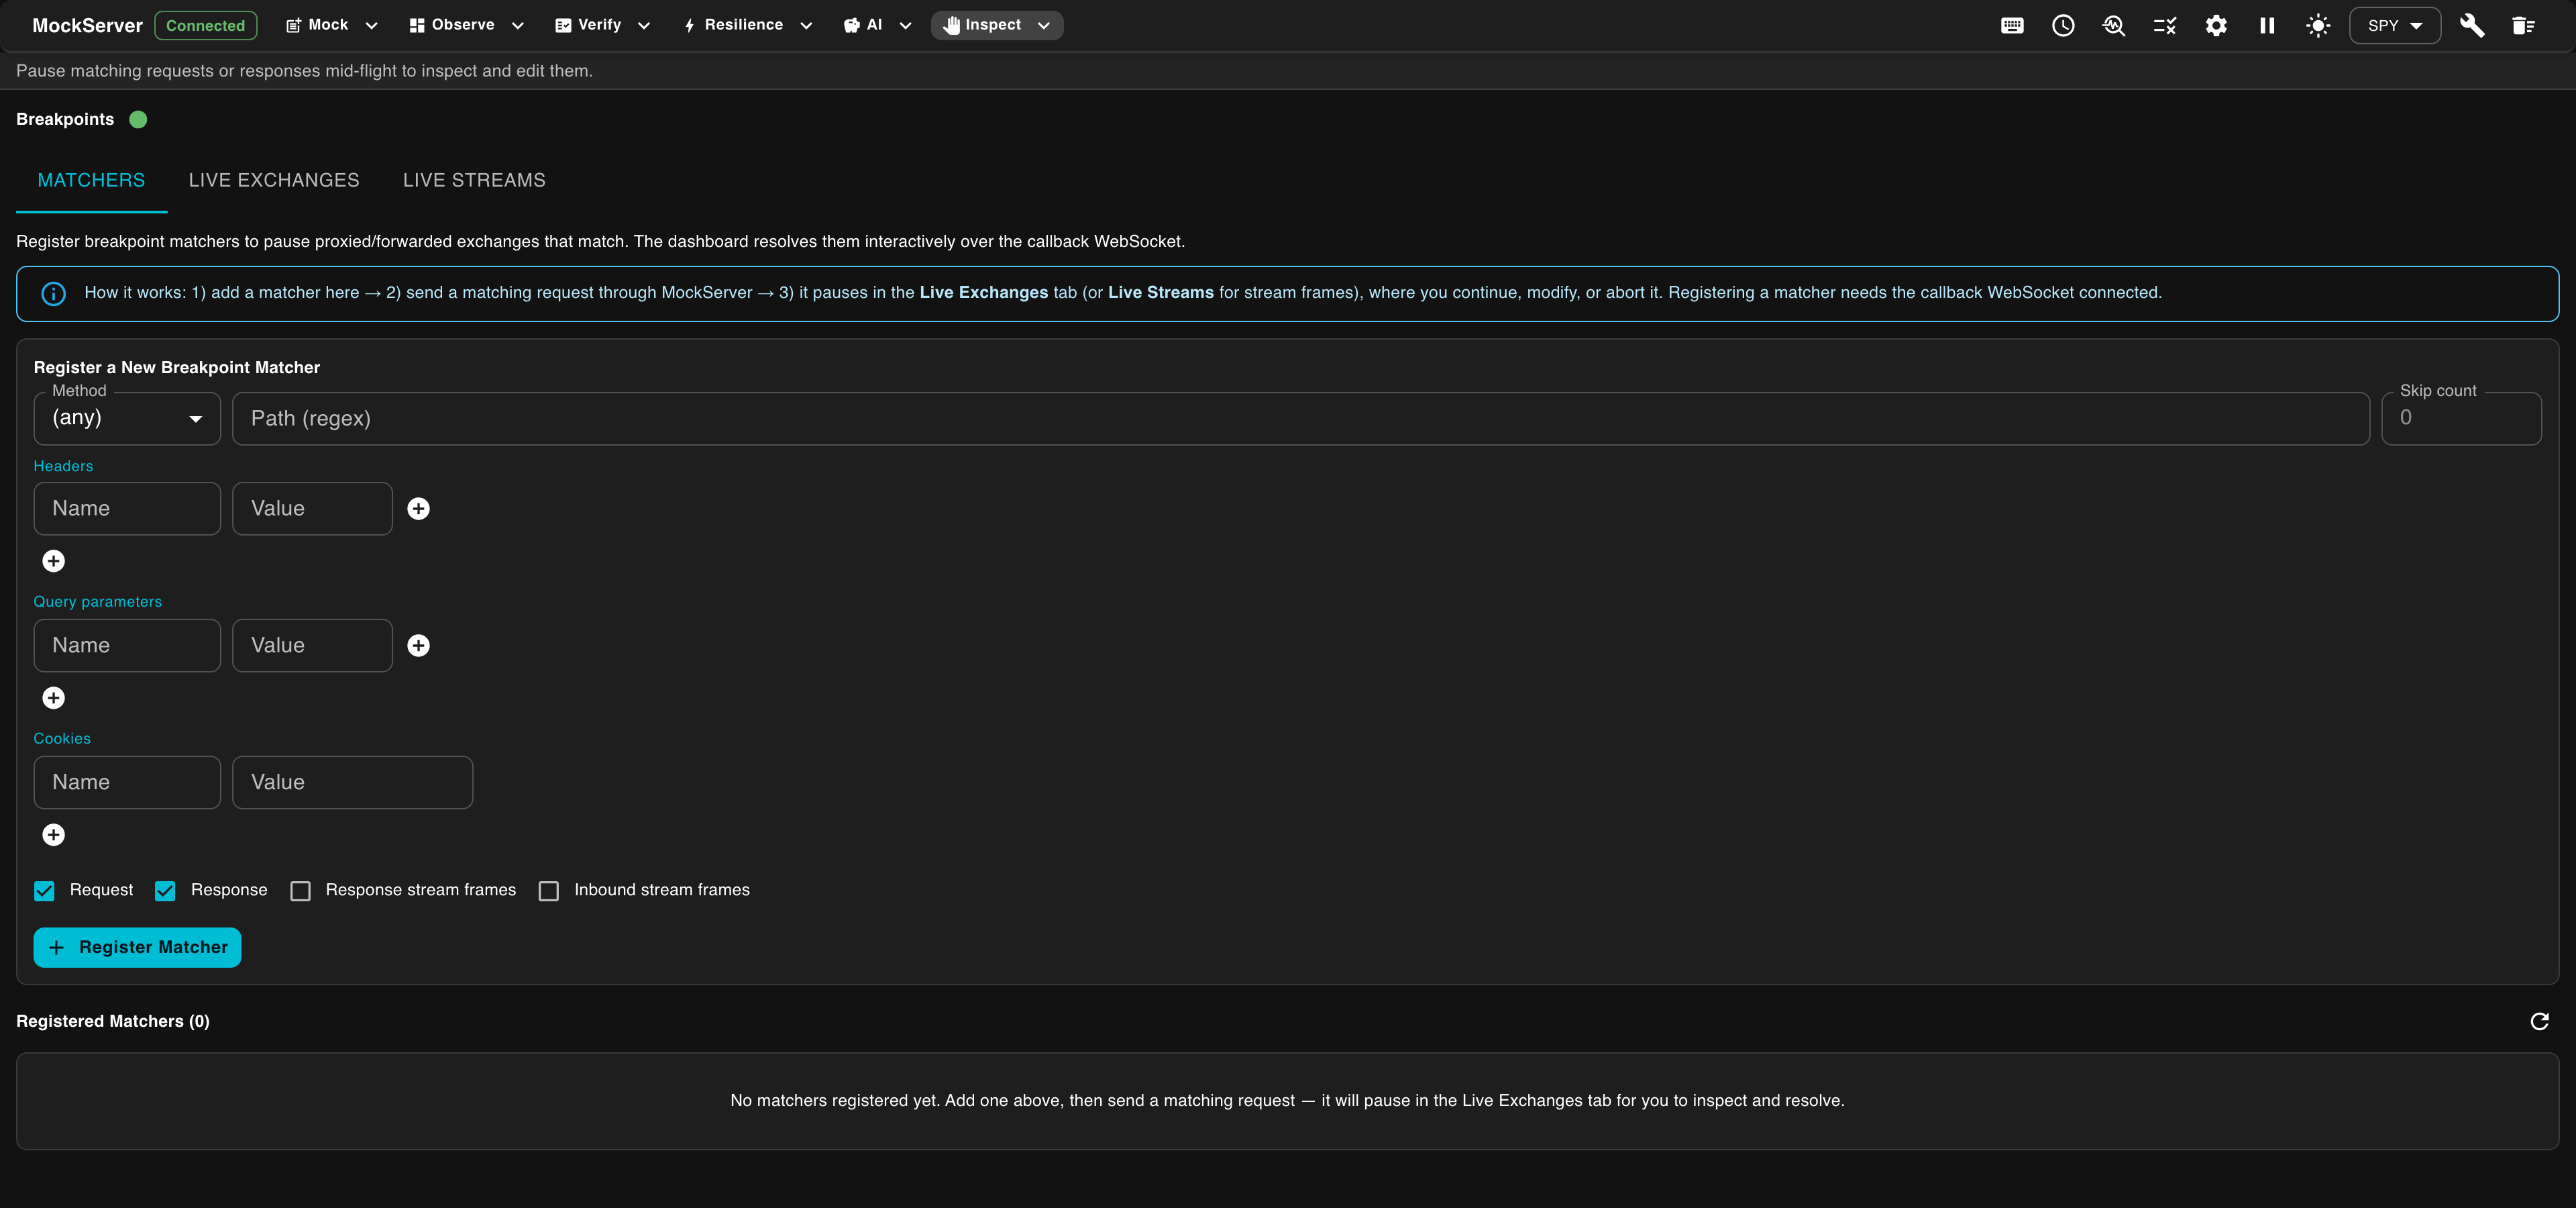
The view has three tabs:
- Matchers — register a new breakpoint matcher (method, path regex, headers, query parameters, cookies) and choose which phases to pause on (Request, Response, Response stream frames, Inbound stream frames). A table of registered matchers shows each matcher's id, pattern, active phases, owner, and a remove action.
- Live Exchanges — request and response exchanges currently paused at a breakpoint, awaiting a decision.
- Live Streams — paused streaming frames (SSE, gRPC, WebSocket, GraphQL subscription), grouped by stream.
The Live Exchanges and Live Streams tabs list all currently paused exchanges and stream frames, grouped by stream. For each frame you can see the frame id, age, body preview, and direction (INBOUND/OUTBOUND). Actions available on each paused item: Continue (release unchanged), Modify (replace the body), Drop (discard), Inject (continue and add a new frame after it), or Close (terminate the stream). Request and response breakpoints show the full request or response for inspection and allow modification or abort before the exchange is forwarded.
See Interactive Breakpoints for the full matcher API reference, callback WebSocket protocol, and configuration details.
Mocks
The Mocks view lets you create or edit mock expectations without writing any code. Open it using the Mocks button in the navigation bar.
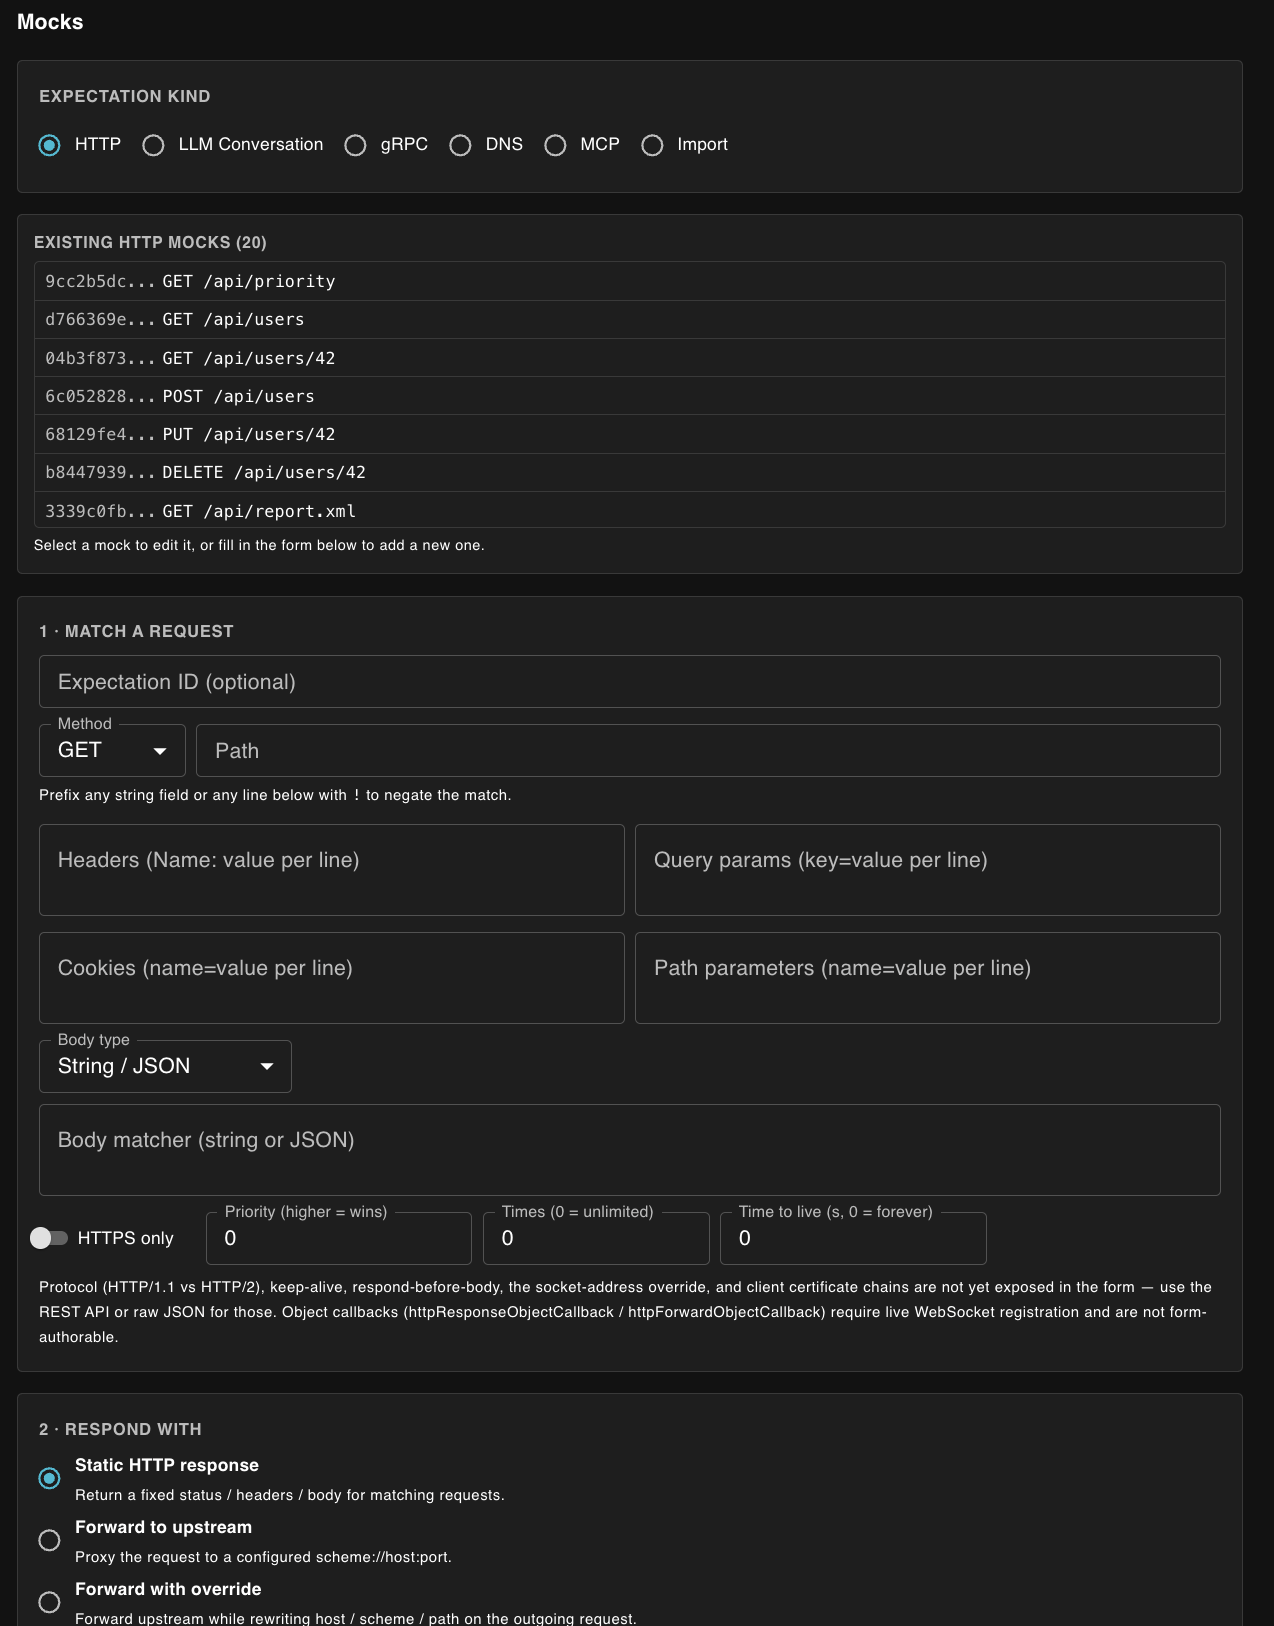
At the top, choose an Expectation kind:
- HTTP — any HTTP mock or proxy rule (described below as the standard HTTP expectation)
- LLM Conversation — multi-turn scripted LLM conversations
- gRPC — gRPC services, transcoded to HTTP
POST /package.Service/Method - DNS — DNS resolution responses, matched by name and record type
- MCP — HTTP response expectations exposed to AI agents as Model Context Protocol tools
- Import — bulk-load expectations from an external source (see Import below)
Standard HTTP Expectation
The Edit existing or add new dropdown lists every active non-LLM expectation. Picking one prefills all fields so you can edit it in place; the Reset button clears the selection to start fresh.
The form is split into four steps:
- Match a request — Expectation ID (optional — used to update an existing expectation), Method, Path, Headers, Query string parameters, Cookies, Path parameters, Body matcher, "Body is binary (base64)" toggle, HTTPS-only toggle, Priority (higher wins when multiple expectations match), Times (how many times the expectation can be used; 0 means unlimited). Prefix any string field or any entry line with
!to negate it — for example,!GETmatches any method except GET. - Respond with — choose a response action: Static HTTP response, Forward to upstream, Forward with override, Class callback, Response template, or Error / fault injection.
- Action details — fields specific to the chosen action (status code and body for a static response; host and port for forwarding; template text for a template response; etc.).
- Review & register — a read-only preview of the generated expectation in Java, JSON, or curl format. Click Register expectation to activate it on the server. If the Expectation ID field is filled, this updates the existing expectation in place.
LLM Conversation
The Edit existing or add new dropdown lists active scripted LLM conversation scenarios by name (for example, weather-agent (2 turns)). Picking one prefills the form with the existing scenario's configuration.
The form is split into three steps:
- Conversation basics — provider (Anthropic, OpenAI, Gemini, etc.), path to match (e.g.
/v1/messages), optional model name, and optional per-session isolation (header, query parameter, or cookie name whose value is used to keep concurrent sessions independent). - Turns — an ordered list of conversation turns. Each turn has an optional match predicate (turn index, message content substring, message role, or tool result presence) and an optional response (text, tool calls, stop reason, token usage, streaming flag).
- Review & register — preview in Java, JSON, or MCP format, then click Register on server (or Update N expectations when editing). When editing an existing scenario, the expectation IDs are reused so the update happens in place.
See LLM Conversation Mocking for full details on conversation predicates and isolation options.
gRPC
The gRPC kind mocks a gRPC service. MockServer transcodes gRPC calls to HTTP, so the request matcher is pre-shaped with the POST method and a /package.Service/Method path pattern; otherwise it uses the same matcher fields as a Standard HTTP expectation. The response action is a gRPC stream response (for streaming RPCs) or a static response (for unary RPCs). See gRPC Support for details.
DNS
The DNS kind mocks DNS resolution. Instead of the HTTP matcher, the form shows a DNS matcher: the DNS name (required), the record type (A, AAAA, CNAME, MX, SRV, TXT, PTR), and the record class (IN, CH, HS, ANY). The response action is a DNS response with a response code (NOERROR, FORMERR, SERVFAIL, NXDOMAIN, NOTIMP, REFUSED) and one or more answer records.
MCP
The MCP kind exposes HTTP response expectations to AI agents as Model Context Protocol tools. The form is the same as a Standard HTTP expectation but limited to static-response expectations. An MCP Tools panel lists the generated tool definitions — each with its tool name, endpoint (method and path), and description — so you can see exactly which tools an agent will discover.
Snippet Palette
When Response template is selected as the response action in the Standard HTTP Expectation form, an Insert snippet button appears next to the template body field. Clicking it opens the snippet palette — a popover menu of curated template expressions organised into three categories:
| Category | What it inserts |
|---|---|
| Request Echoes | Expressions that mirror values from the incoming request back into the response — for example, the request method, path, a named header, a query parameter, or the request body. |
| Dynamic Data | Expressions that generate data at response time — for example, the current date/time, a random UUID, a random integer, or the current epoch timestamp. |
| Structure | Structural template constructs — for example, an if / else block, a foreach loop, or a JSON object wrapper. |
The palette is engine-aware: it shows the correct syntax for whichever template engine is currently selected in the form — Velocity, Mustache, or JavaScript. Each snippet entry shows the expression syntax as a chip, a short description, and an example rendered value. Click any snippet to insert it at the cursor position in the template body field.
Import
The Mocks view has an Import radio button at the top of the form (alongside Standard HTTP expectation and LLM Conversation). Selecting it replaces the composer form with an import form that lets you bulk-load expectations from an external source without writing any code.
Five import formats are supported:
| Format | How to supply | What MockServer creates |
|---|---|---|
| Expectation JSON | Paste JSON or enter a URL pointing to a raw JSON file | Expectations loaded directly from MockServer's own format — a lossless round-trip for previously exported expectations |
| OpenAPI | Paste an OpenAPI v3 spec (JSON or YAML) or enter a URL | One mock expectation per operation (method + path combination), with example responses where defined |
| WSDL / SOAP | Paste a WSDL 1.1 document | One mock expectation per SOAP operation, with a templated XML response body |
| HAR (HTTP Archive) | Paste a HAR JSON file captured from browser DevTools or a proxy | One mock expectation per request/response pair in the archive |
| Postman collection | Paste a Postman collection v2.x JSON export | One mock expectation per request, with the example response where available |
All import operations call the relevant MockServer control-plane endpoint (PUT /mockserver/expectation, PUT /mockserver/openapi, PUT /mockserver/wsdl, or PUT /mockserver/import?format=har|postman) and report how many expectations were created. Import is additive — it does not clear existing expectations. See Importing Expectations for details on each format.
Chaos
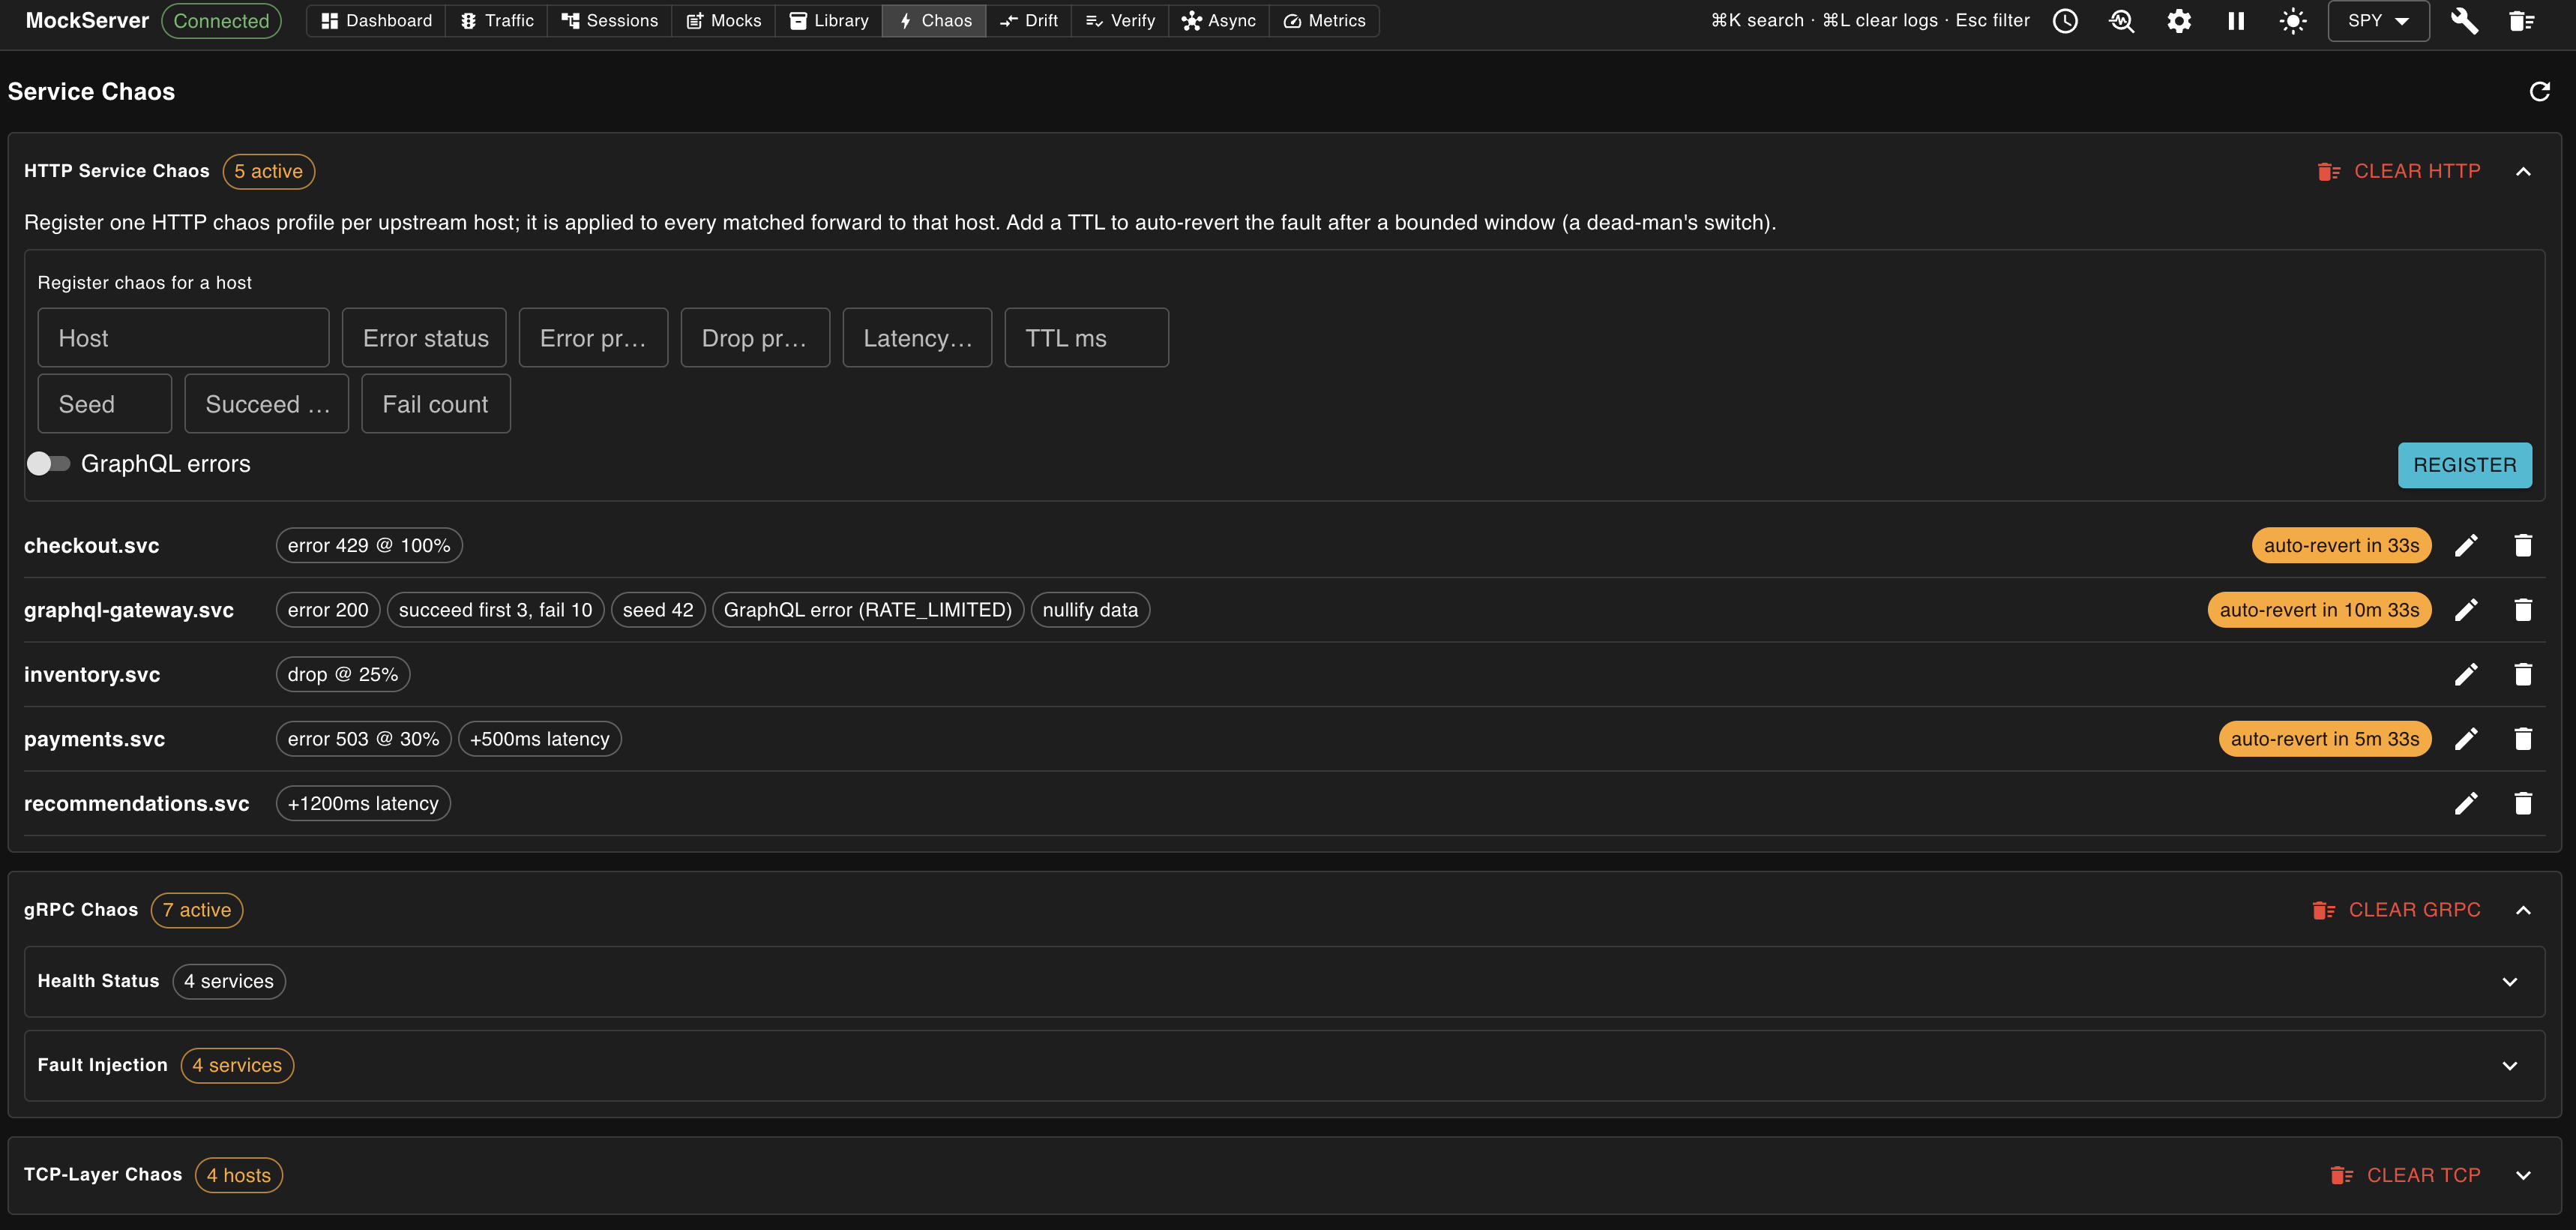
The Chaos view groups service-scoped chaos into three collapsible sections — HTTP Service Chaos, gRPC Chaos (health status + fault injection), and TCP-Layer Chaos — each with its own Clear button (Clear HTTP / Clear gRPC / Clear TCP) in its header.
It lets you inject service-scoped chaos — faults that MockServer applies to every request it forwards to a given upstream host or service, rather than to a single expectation. This is useful for resilience and SRE testing, where you want all proxied traffic to a dependency to fail or slow down for a while without editing individual mocks.
Under Register chaos for a host, enter the upstream Host and any combination of the faults below, then click Register. The form exposes the full HTTP service-chaos fault set; leave a field blank to skip that fault. Each registration is sent to the server as one chaos profile via the PUT /mockserver/serviceChaos endpoint.
Error and connection faults
- Error status — an HTTP error status code (e.g.
503) returned instead of forwarding. - Error prob (0–1) — the fraction of requests that receive the error status, so only some requests fail. Applies alongside an error status.
- Retry-After — value for the
Retry-Afterresponse header sent with the injected error (meaningful with statuses such as429or503). - Drop prob (0–1) — probability that MockServer drops the connection instead of responding.
- Latency ms — milliseconds of delay added before each matched response.
- Seed — fixes the random draw used by the probabilistic faults so a fractional probability is reproducible across runs.
Response-body corruption
- Truncate body (0–1) — keep only this leading fraction of the response body bytes, simulating a cut-off response.
- Malformed body — append a broken-JSON fragment to corrupt the body, for testing client-side parsing resilience.
- Slow chunk bytes + Slow chunk delay ms — dribble the response body in chunks of the given size with the given delay between chunks, for testing read timeouts on a trickling response.
Quota / rate limit
A fixed-window rate limit: once Quota limit requests have been seen within Quota window ms, further requests are rejected. Expectations and registrations that share a Quota name share one counter.
- Quota name — the shared counter key.
- Quota limit — maximum requests allowed per window.
- Quota window ms — window length in milliseconds.
- Quota error status — status returned when the quota is exceeded (default
429).
Count and time windows
- Succeed first — the first N matching requests are not faulted (the service appears healthy at first).
- Fail count — after the "succeed first" requests, the next M requests are eligible for faults, then the service recovers.
- Outage after ms / Outage duration ms — a self-healing time window measured from the first match: chaos starts after "outage after" milliseconds and (when a duration is set) stops after "outage duration" milliseconds.
- Degradation ramp ms — ramp the error and drop probabilities linearly from
0up to their configured values over this many milliseconds, so a dependency appears to deteriorate gradually rather than failing all at once.
GraphQL error envelope
Enable GraphQL errors to rewrite the response as a GraphQL error envelope (HTTP 200 with a {"data": null, "errors": [...]} body) instead of an HTTP error status — the way a GraphQL API typically signals failure. Optionally set an Error message and an Error code (placed under errors[0].extensions.code).
TTL
- TTL ms — how long the chaos stays active, in milliseconds. When the TTL elapses MockServer automatically reverts the fault (a dead-man's switch), so a forgotten chaos run cannot break later tests.
The Active registrations panel lists each host with chaos in force and its remaining auto-revert countdown (or shows No service-scoped chaos registered when none is set). Each registration can be edited in place or removed with its remove icon (trash), or use the section's Clear HTTP / Clear gRPC / Clear TCP button to remove everything in that section at once. Injected faults are also counted in the Metrics view under HTTP Chaos Faults.
To drive load alongside chaos — inject a fault and simultaneously apply load to verify resilience — see the Performance view.
Performance
The Performance view lets you create, run, and monitor load scenarios directly from the dashboard — server-side load generation that drives traffic at a target and charts live throughput and latency. Switch to it using the Performance button in the navigation bar. Load generation must be enabled first (configuration property loadGenerationEnabled / MOCKSERVER_LOAD_GENERATION_ENABLED); until then the panel shows the configuration flag needed to unlock it.
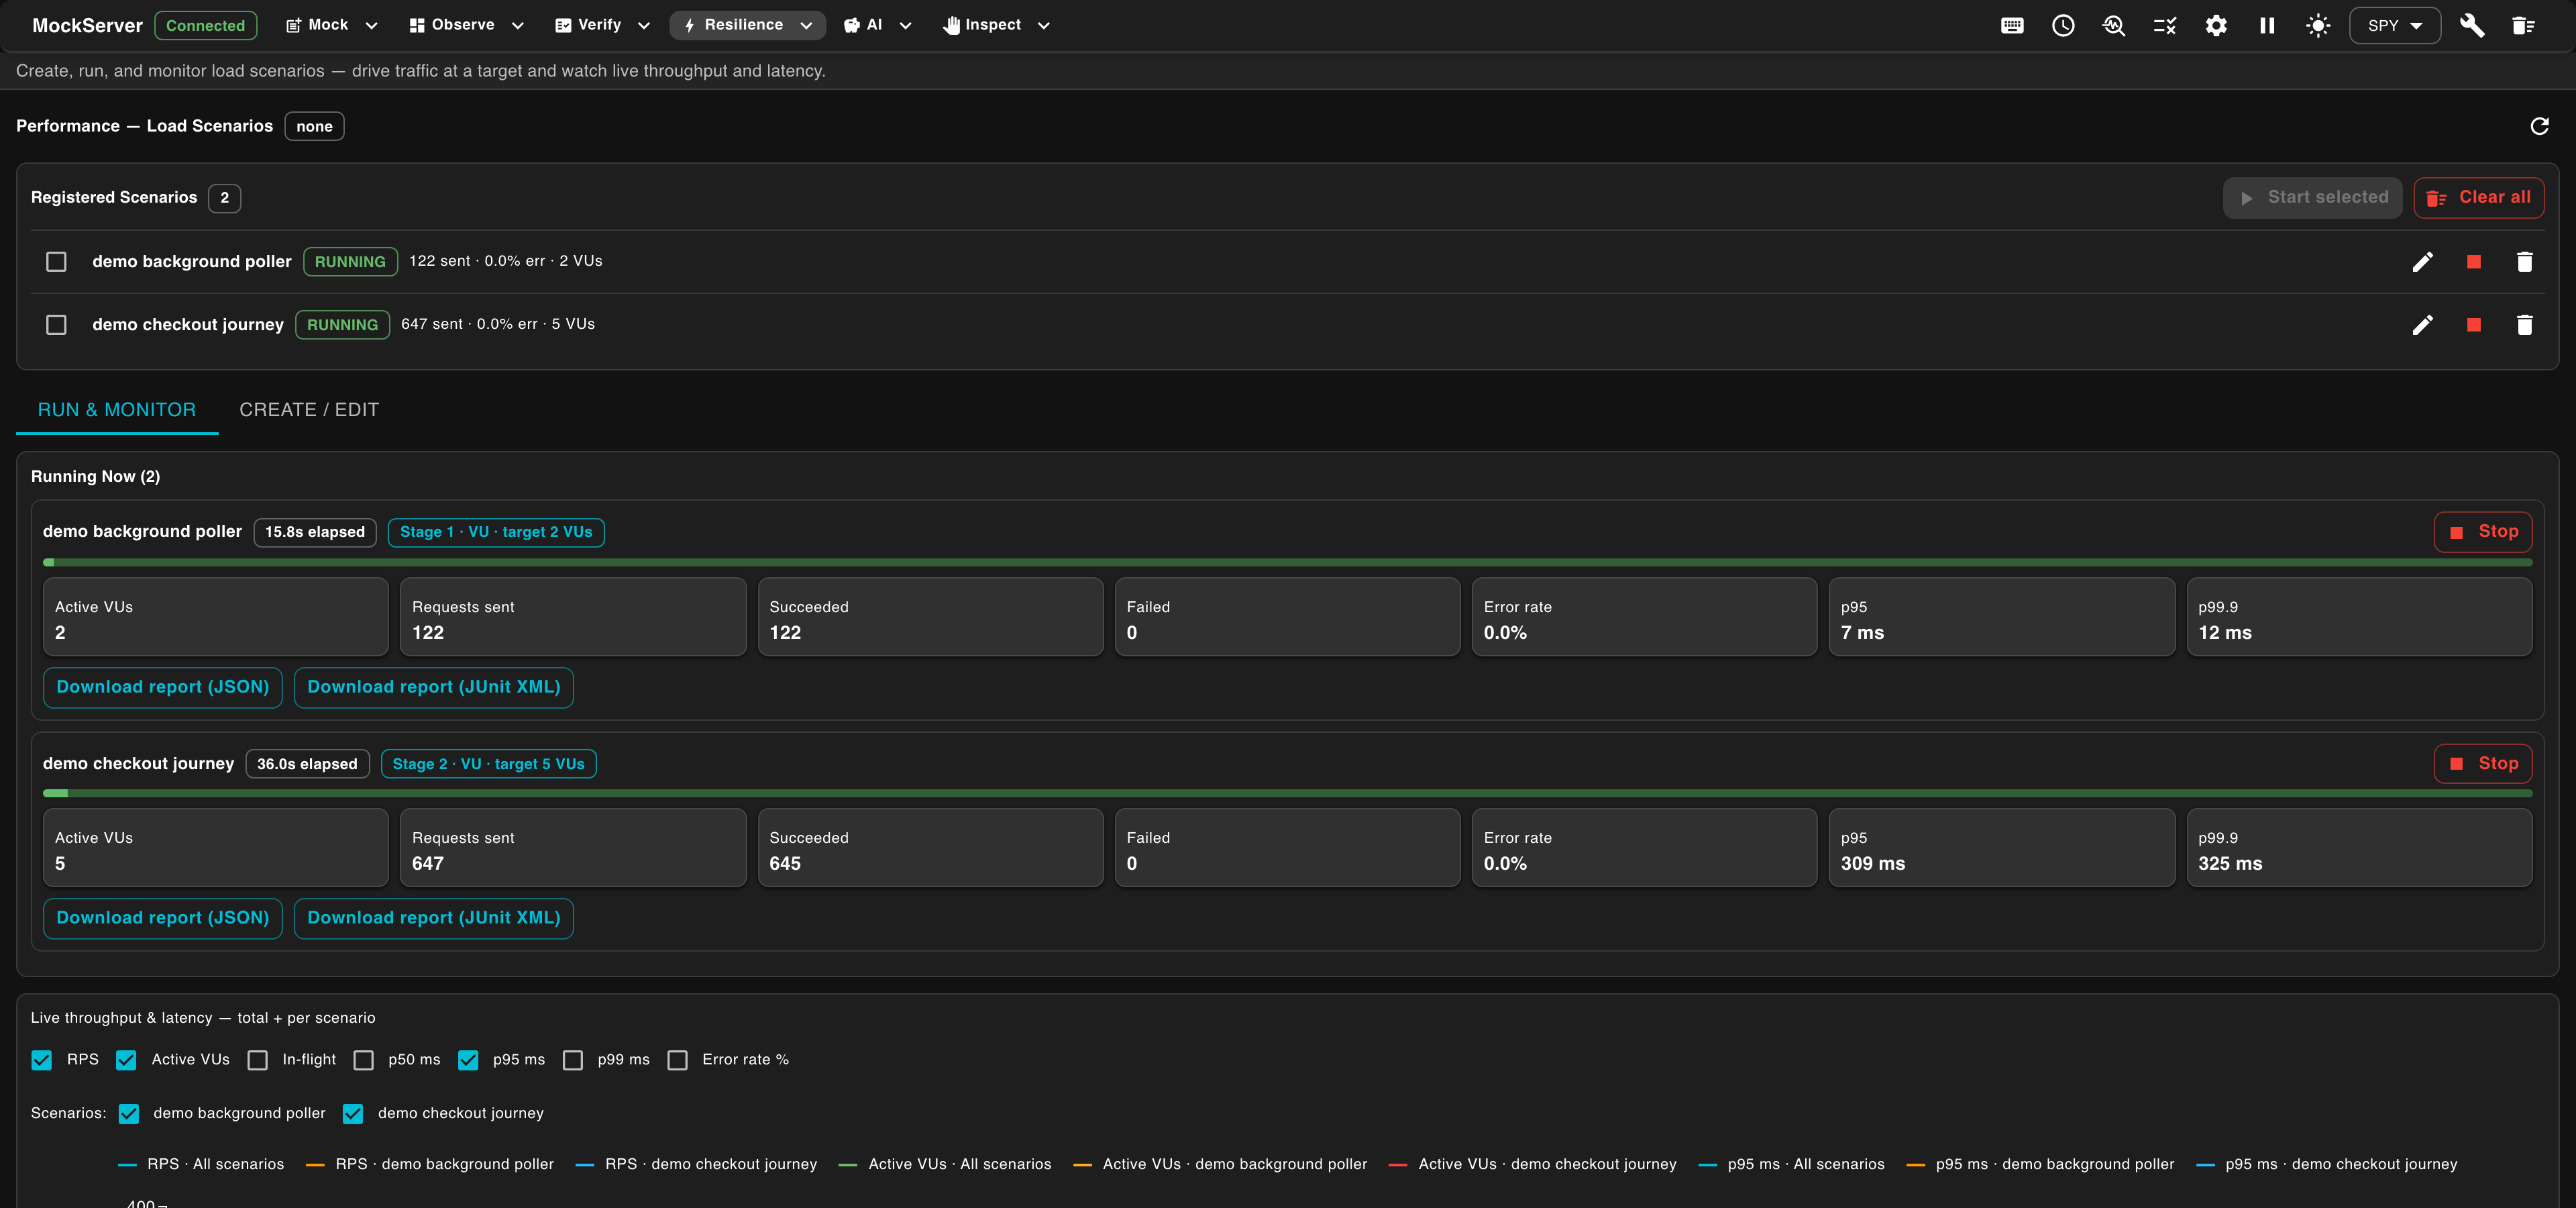
The view has three areas:
- Stage builder — add an ordered list of stages to the load profile. For each stage choose:
- VU (closed model) — hold a fixed number of concurrent virtual users, or ramp from
startVustoendVus - RATE (open model) — hold or ramp an arrival rate in iterations per second, with an optional
maxVuscap on the auto-scaling VU pool - PAUSE — drive no load for the duration (lets the target recover between stages)
- VU (closed model) — hold a fixed number of concurrent virtual users, or ramp from
- Live status — once a scenario starts, the panel shows the running scenario name and run id, the current stage index, stage type (
VU/RATE/PAUSE), current target (active VUs or arrival rate), elapsed time, requests sent, success / error rate, and latency percentiles (p50 / p95 / p99). The status pollsGET /mockserver/loadScenarioand refreshes automatically. - Metrics graph — a toggleable combined chart showing throughput (requests/second) and p95 latency over the lifetime of the run, drawn from the
mock_server_load_*Prometheus family. The graph requiresmetricsEnabled=true.
Two buttons sit below the form: Load registers the scenario without running it (staged ready to trigger), and Load & Run registers it and starts it immediately; while a run is active, Edit running and Stop replace them. The same lifecycle is available over the control plane: PUT /mockserver/loadScenario registers a scenario, PUT /mockserver/loadScenario/start triggers it, and DELETE /mockserver/loadScenario stops it. Enable sloTrackingEnabled as well to record latency / error SLO samples for the run. See Performance Testing / Load Injection for the full REST API reference, safety caps, SLO integration, and Prometheus metric catalogue.
LLM Optimise
The LLM Optimise view analyses captured LLM traffic and produces an optimisation brief — concrete, ranked opportunities to cut inference cost and latency and tighten prompt hygiene. Switch to it using the LLM Optimise button in the navigation bar. It is read-only analysis over traffic MockServer has already proxied or recorded; it does not change any mocks.
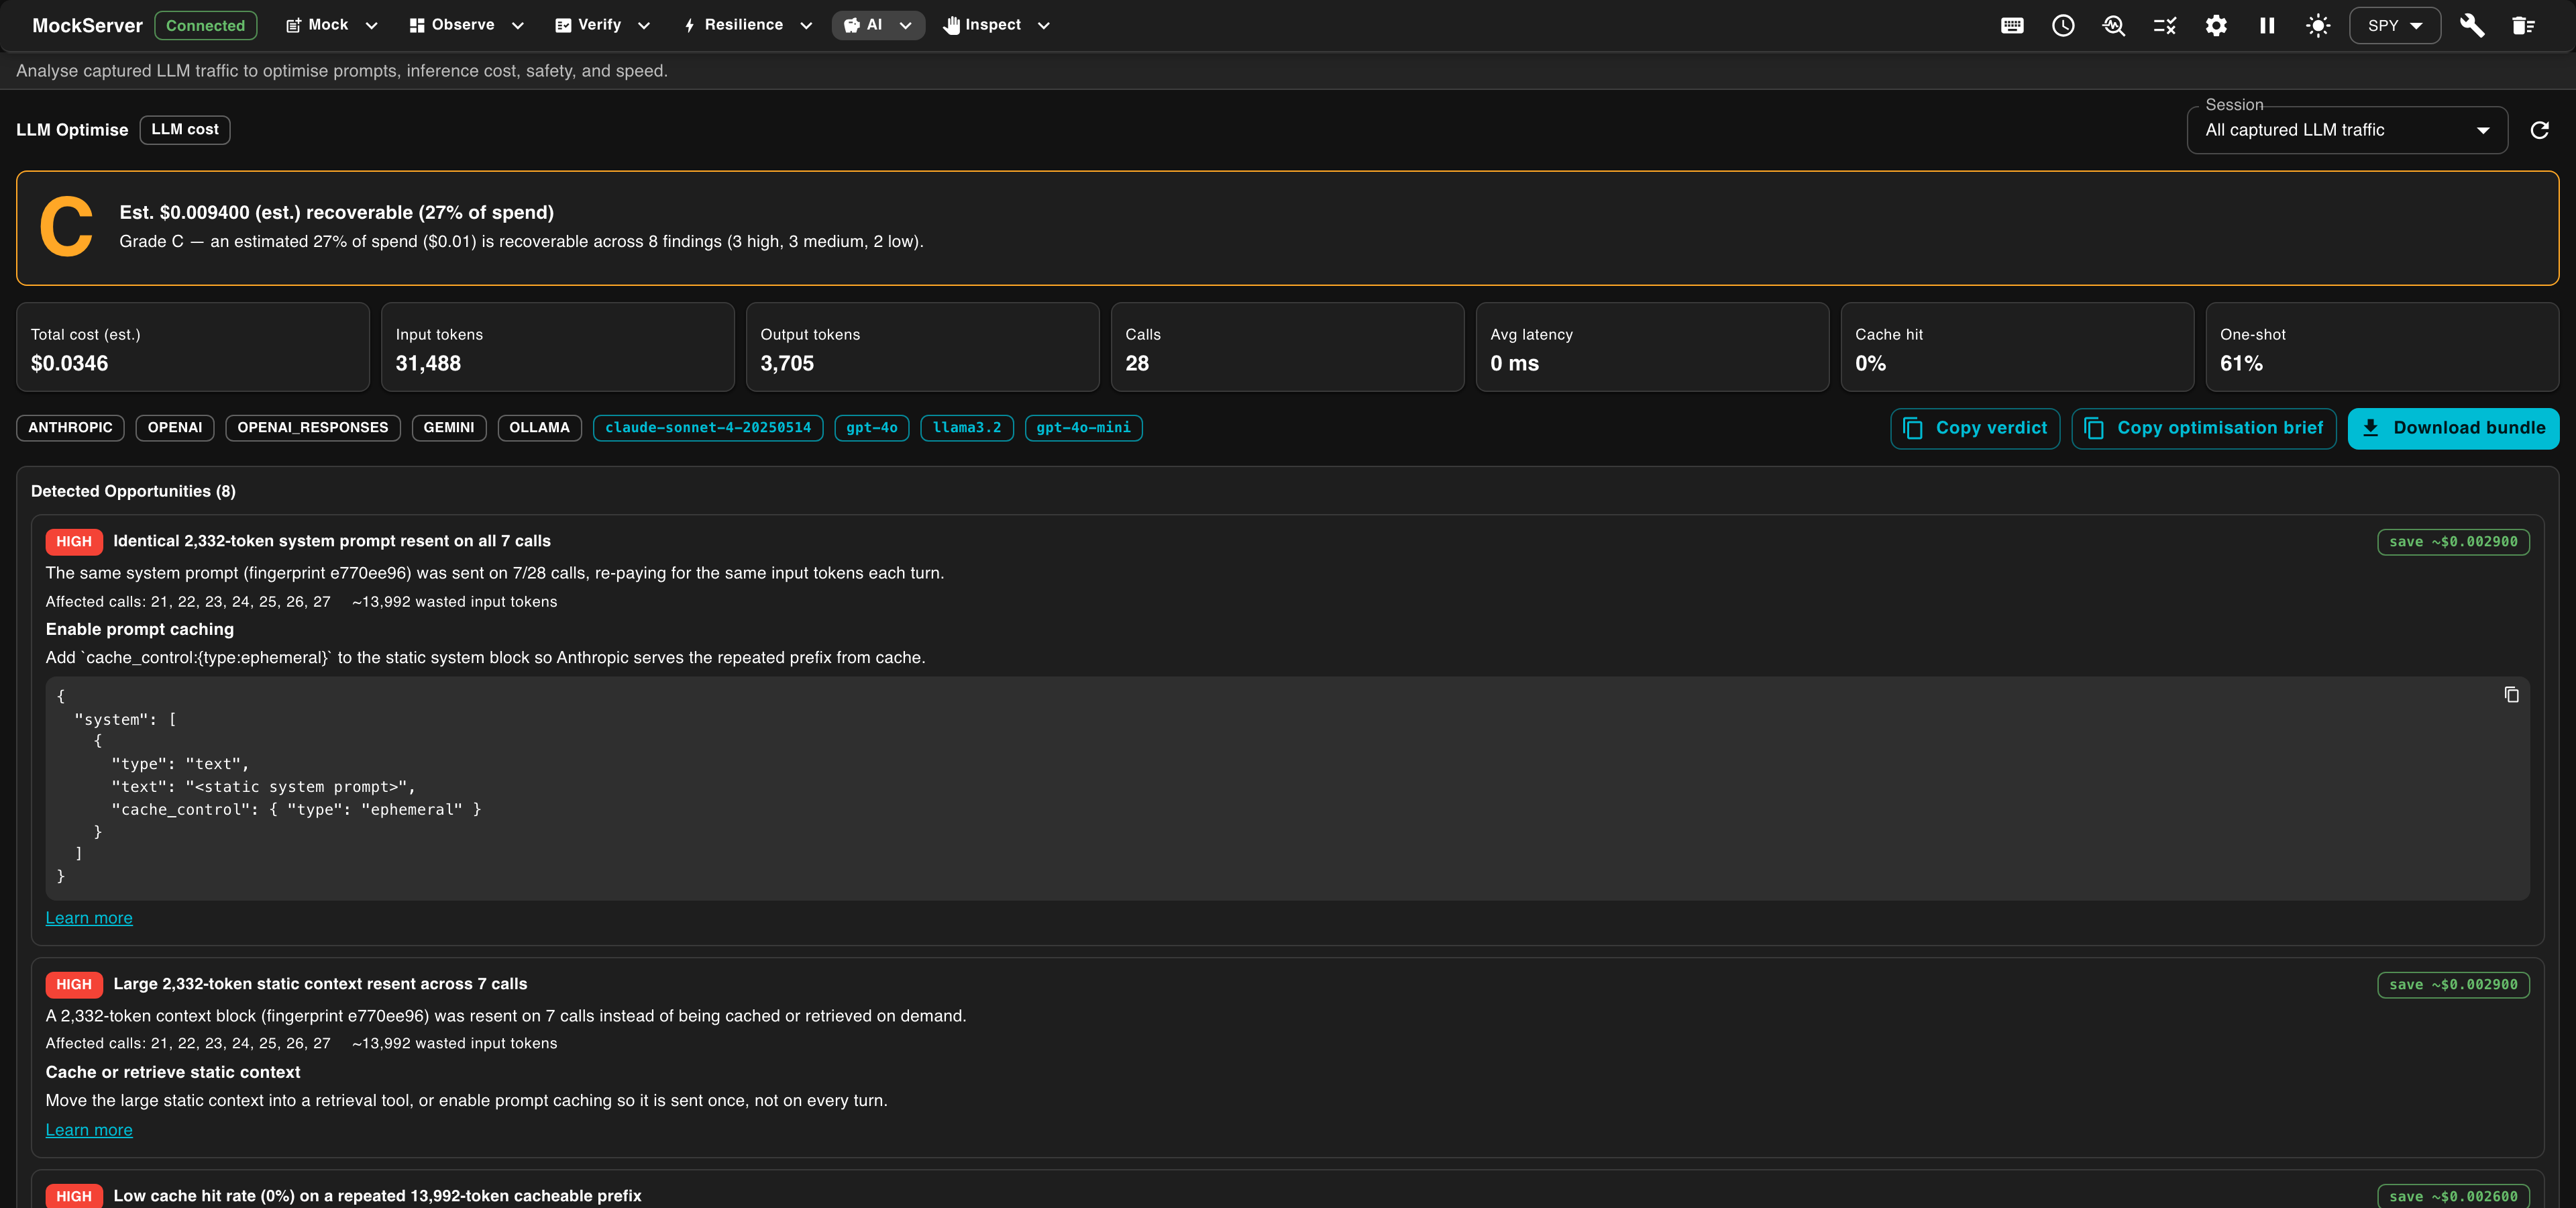
A header strip summarises the analysed traffic — estimated total cost, input and output token totals, call count, and latency — with a Session selector to scope the analysis (for example, all captured LLM traffic). Below it, Detected Opportunities lists each finding as a card with a severity, an explanation, and a concrete Recommendation. Signals include repeated identical system prompts (candidates for prompt caching), large static context resent every turn, tool lookups that could be made deterministic, oversized tool results, duplicate consecutive calls, and output-token bloat.
Use Copy optimisation brief to copy a Markdown summary for an LLM or teammate to act on, or Download bundle for the full JSON. The same report is available over the control plane and as an MCP tool. See LLM Optimisation for the full signal set.
MCP Server Health
The MCP Server Health view shows, per MCP server, how the MCP servers your proxied tools call are actually performing — so when a coding-assistant CLI feels slow, you can see whether the MCP server is the real bottleneck rather than MockServer itself. Switch to it using the MCP Health button (in the AI group) in the navigation bar. It is read-only analysis derived from the MCP (JSON-RPC over HTTP) traffic MockServer has already proxied or recorded; it does not change any mocks.
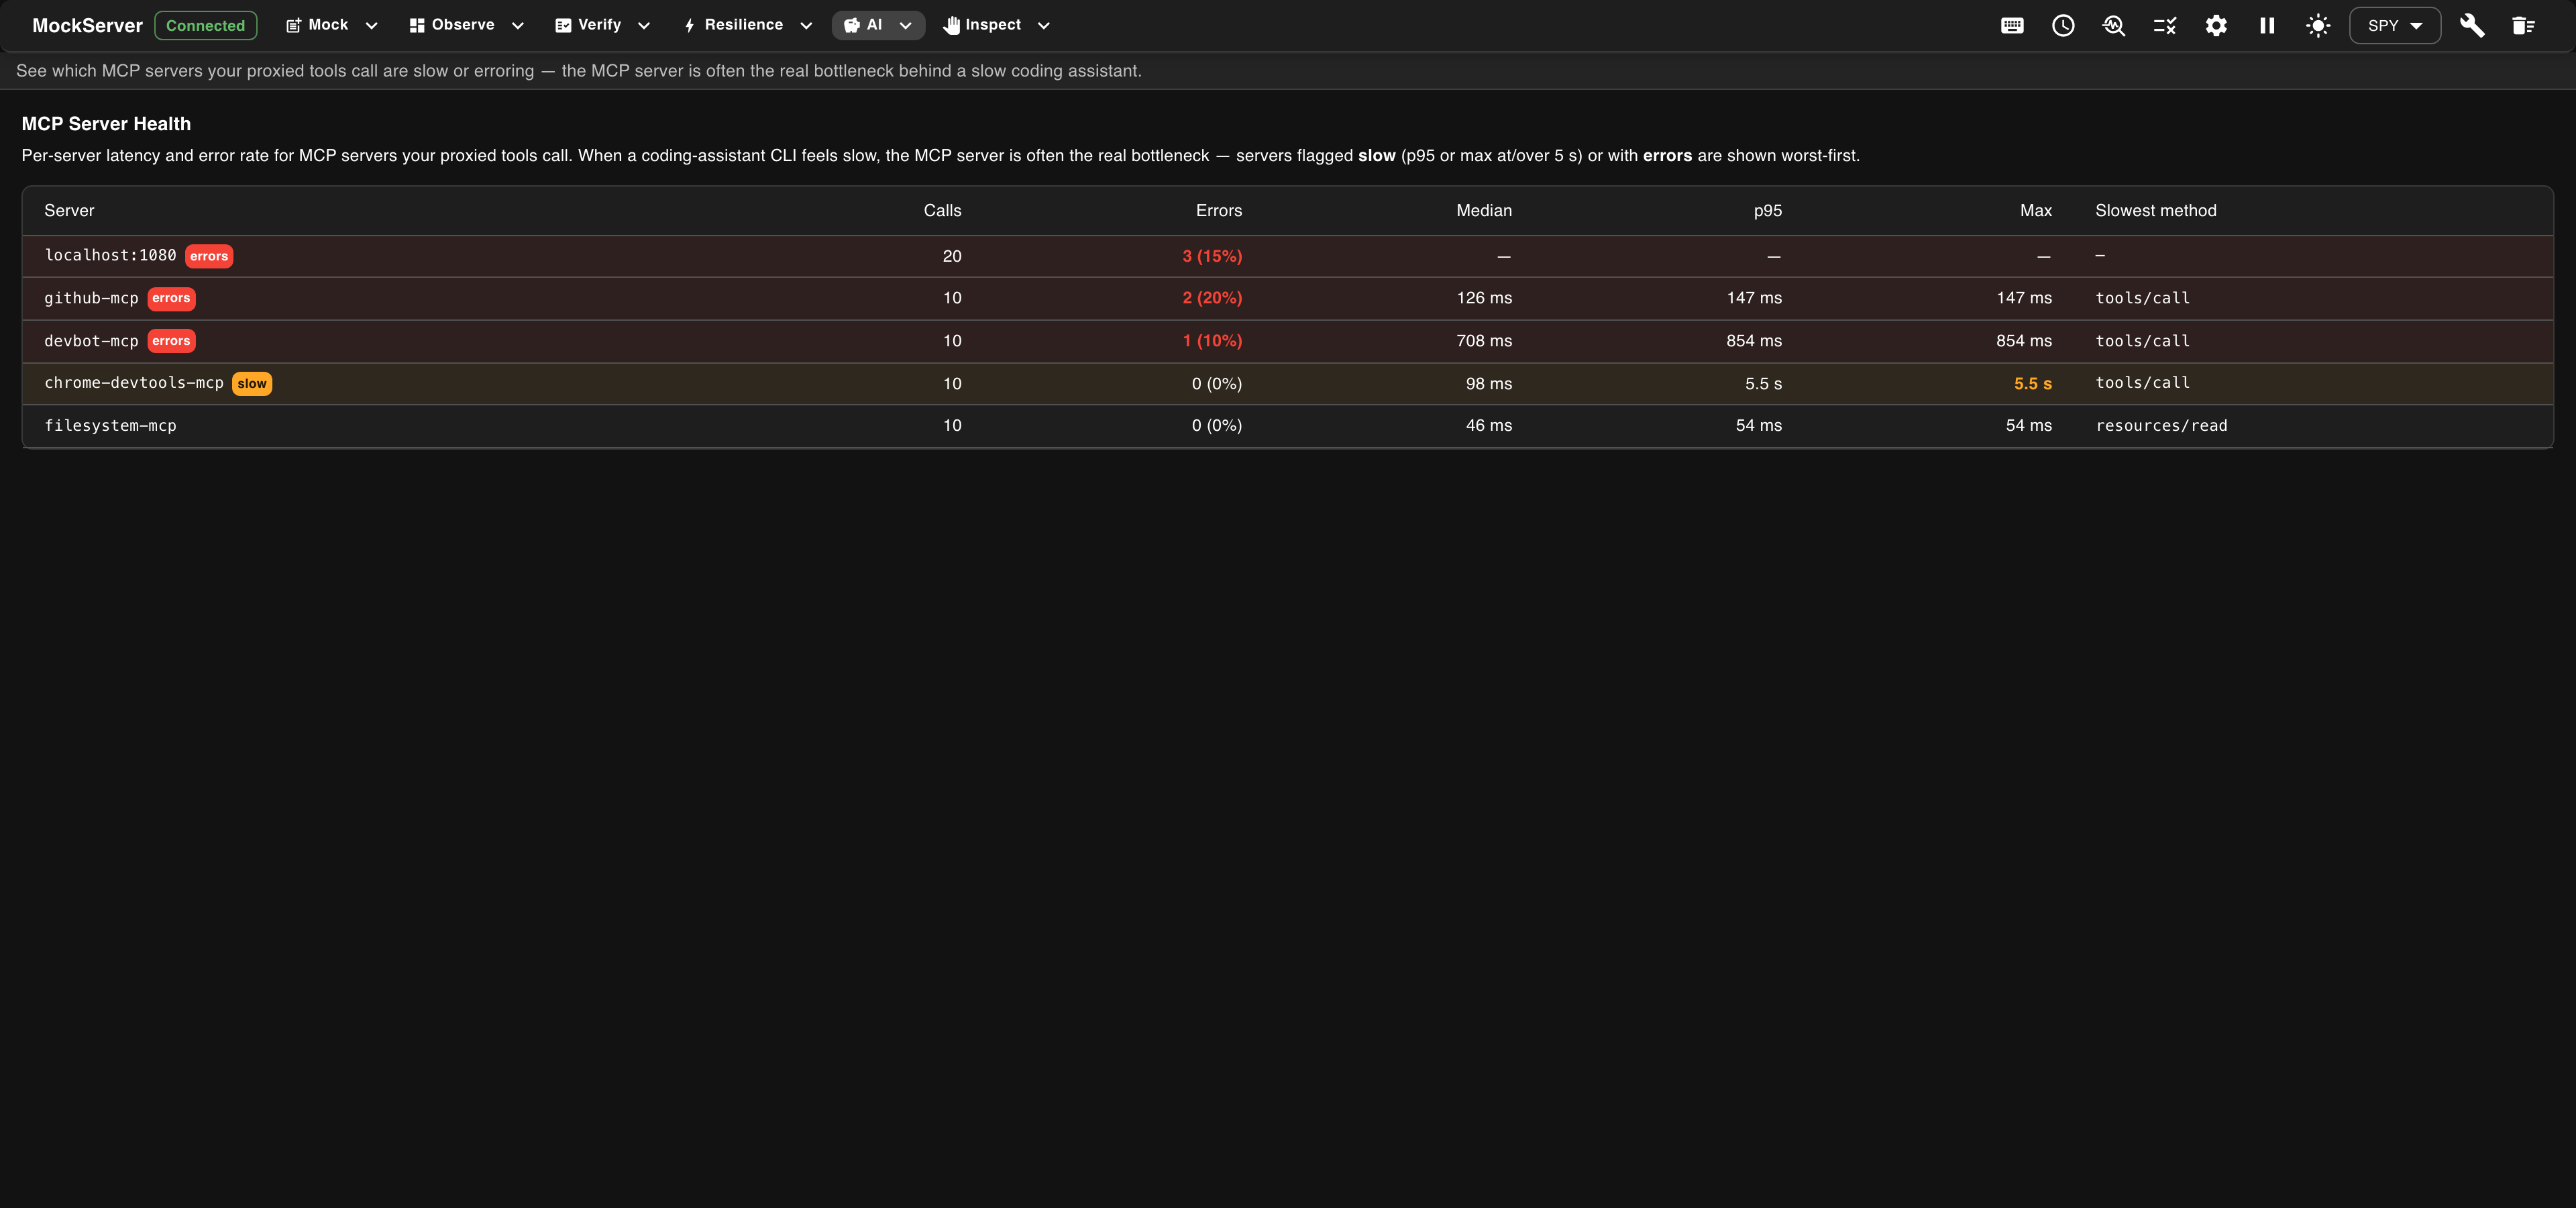
Each row is one MCP server (grouped by host), shown worst-first, with:
- Calls — how many MCP tool calls were made to that server.
- Errors — the error count and rate (a JSON-RPC error response or a non-2xx status).
- Median, p95, and Max latency — how long that server took to respond.
- Slowest method — the tool method behind the slowest call.
A server is flagged slow when its p95 or max latency is at or over the slow threshold, and errors when any call failed, so the servers most likely to be hurting your assistant rise to the top. When no MCP traffic has been captured yet, the view explains that proxying a tool that talks to MCP servers will populate it. See MCP Tools for MockServer's MCP support.
Async
The Async view shows the live status of the AsyncAPI broker mock — MockServer's message-broker mocking for Kafka, AMQP, MQTT, and other async transports. Switch to it using the Async button in the navigation bar. The view polls the server every few seconds and refreshes automatically; you can also refresh on demand.
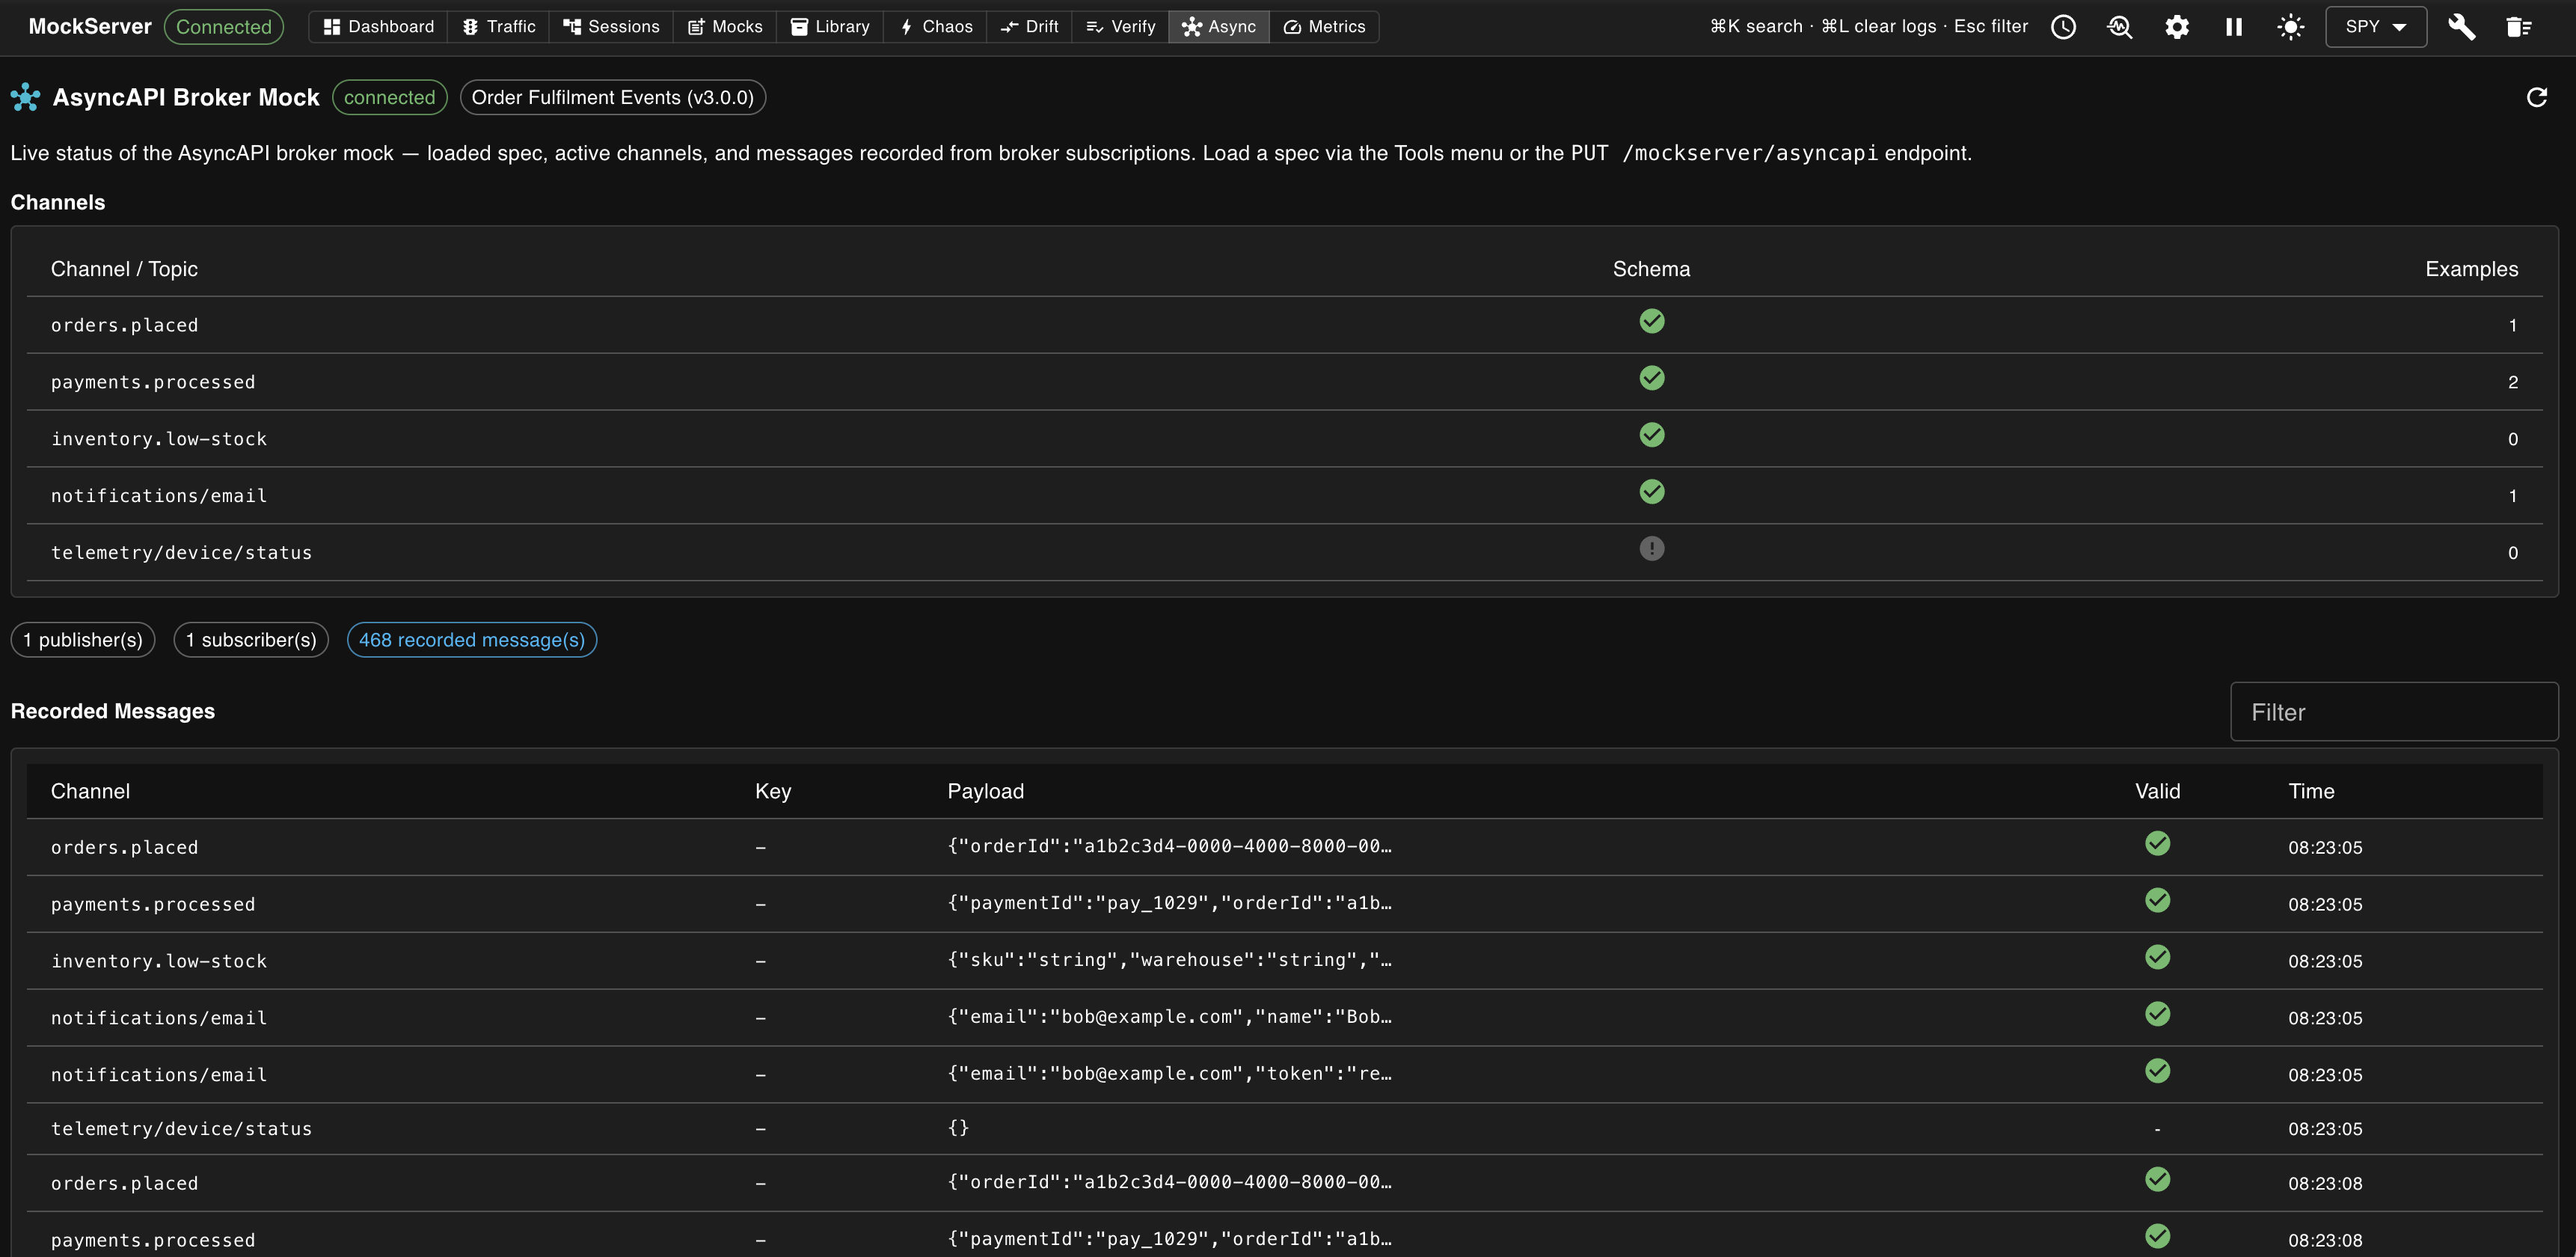
At the top a status chip shows whether a spec is loaded (and its title and version). The view then shows:
- Channels — each channel (topic) defined by the loaded AsyncAPI spec, whether it has a message schema, and how many example messages it carries.
- Publisher / subscriber summary — how many publishers and subscribers are active, and how many messages have been recorded.
- Recorded Messages — messages captured from broker subscriptions, showing the channel, message key, payload, schema-validity, and time. A filter box narrows the list by channel, key, or payload.
Load a spec from the AsyncAPI Broker Mock entry in the title-bar Tools menu (or via the PUT /mockserver/asyncapi endpoint). To see recorded messages, enable consumers in your broker configuration and publish messages to the channels. If the optional AsyncAPI module is not on the server's classpath, the view shows an unavailable notice instead.
gRPC
The gRPC view lists the gRPC services MockServer can mock and inspect, loaded from compiled protobuf descriptors. Switch to it using the gRPC button in the navigation bar. The view polls the server and refreshes automatically.
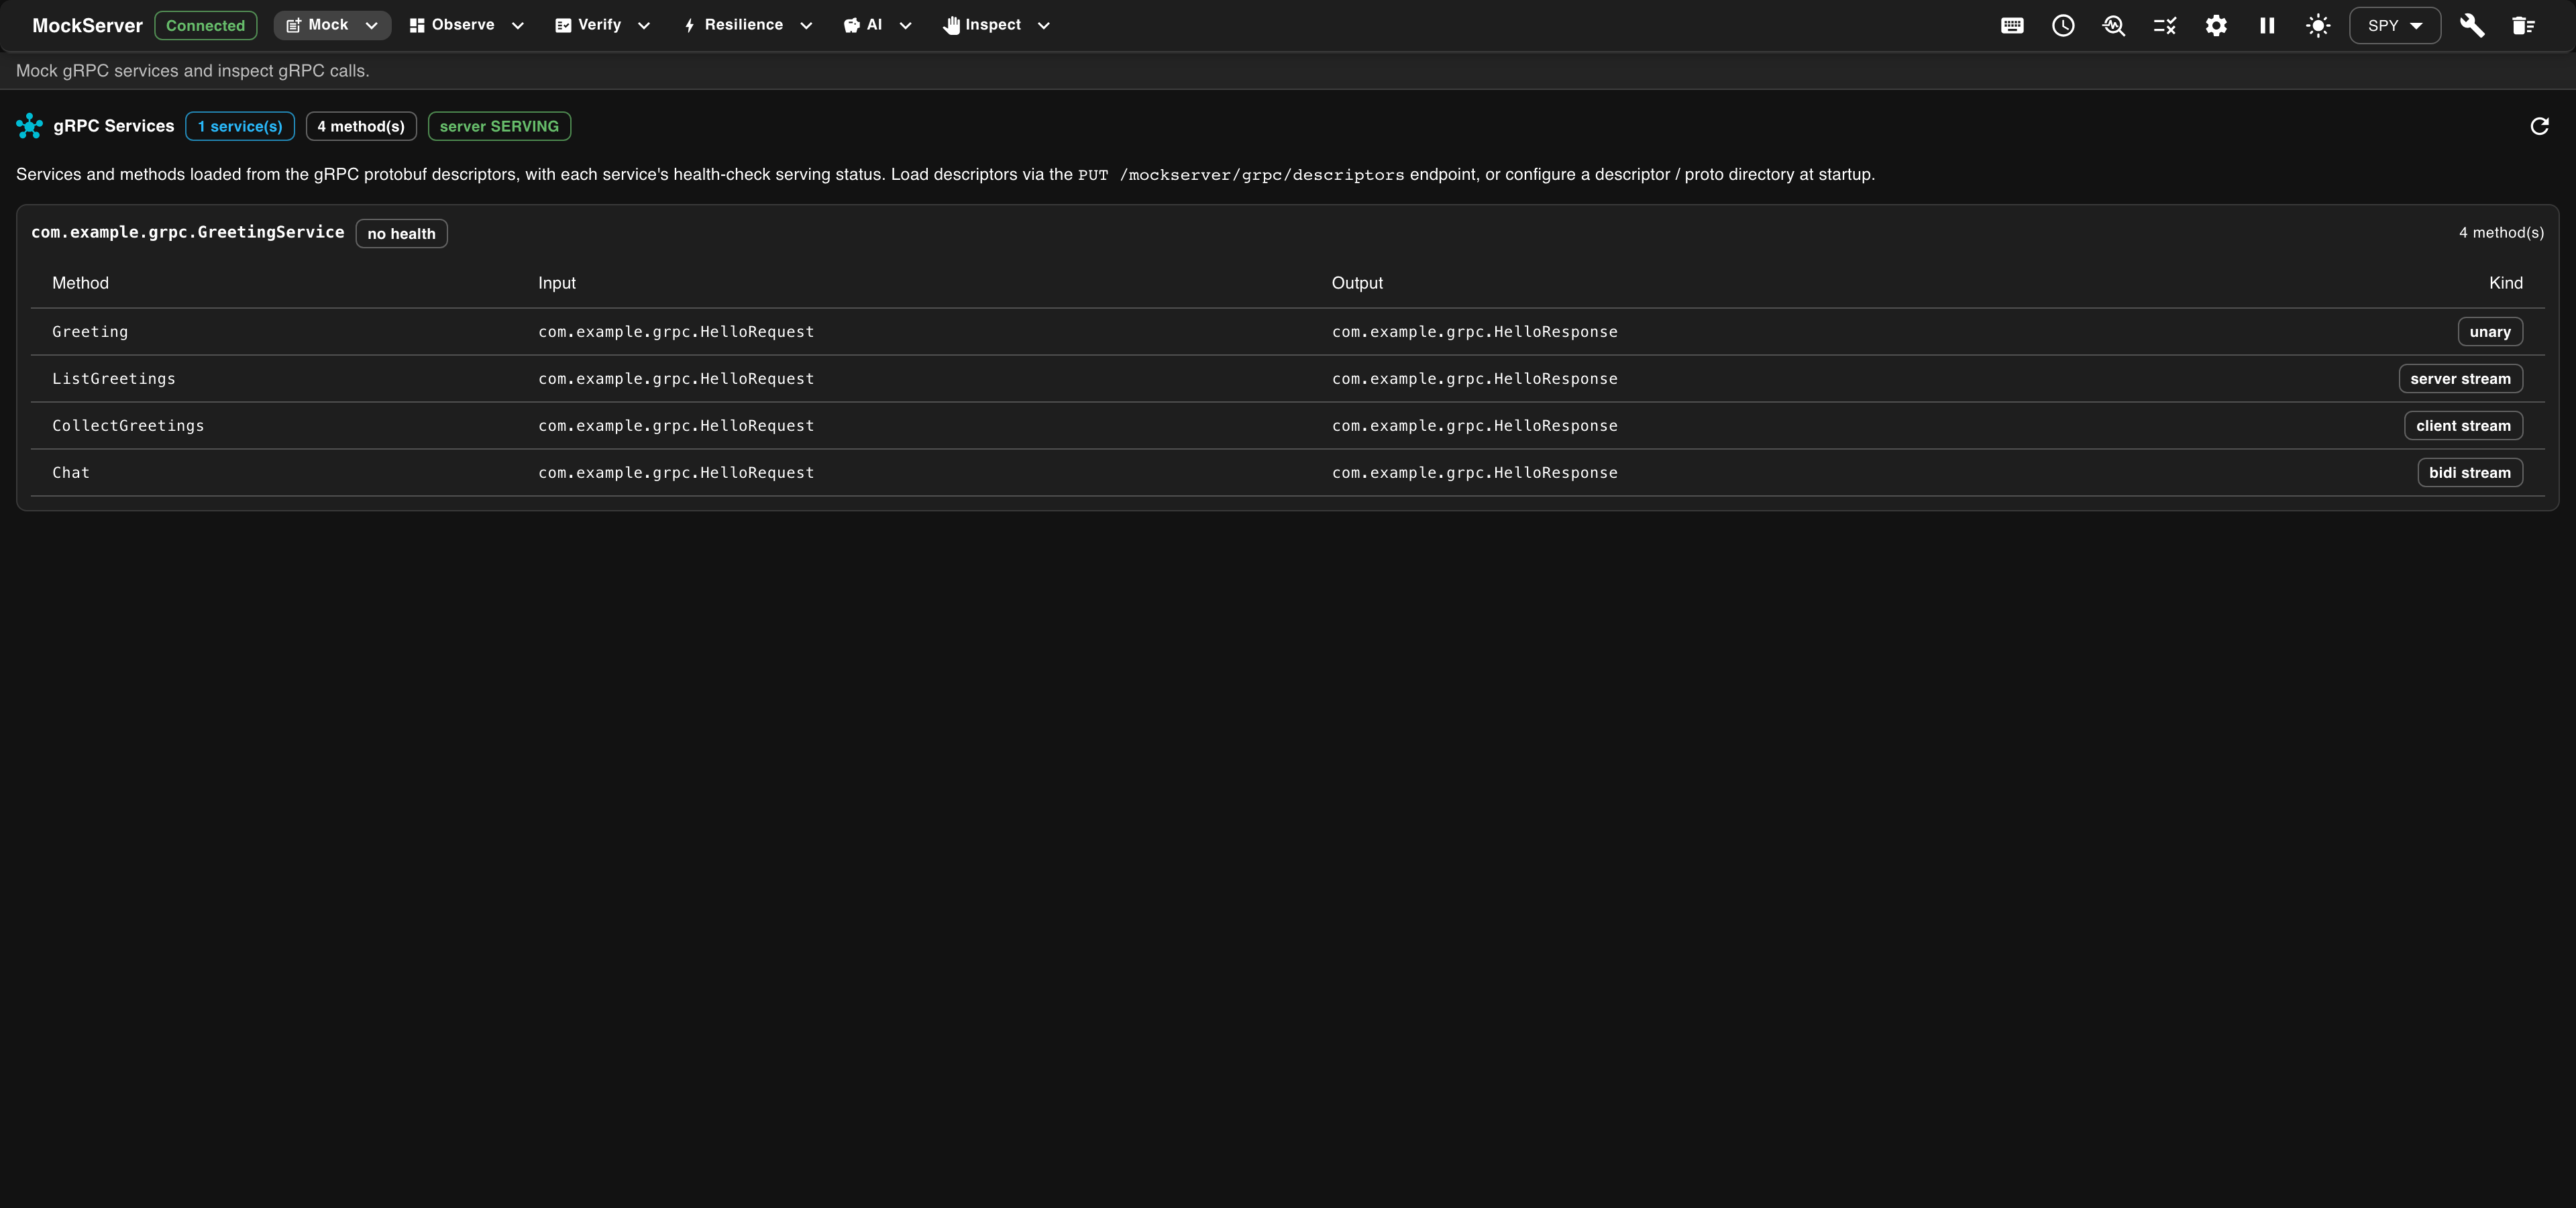
For each loaded service it shows every method with its input → output message types and its streaming Kind (unary, server stream, client stream, or bidirectional stream), plus the service's health-check serving status (for example, SERVING). Load descriptors by uploading a FileDescriptorSet in the Library view's gRPC Descriptors sub-tab, by calling PUT /mockserver/grpc/descriptors, or by configuring a descriptor / proto directory at startup. See gRPC Mocking for how to mock gRPC methods.
Library
The Library view consolidates importing, exporting, and fixture file management. It has five sub-tabs: Import, Export, Cassettes, WASM Modules, and gRPC Descriptors.
Import
The Import sub-tab bulk-loads expectations from an external source — Expectation JSON, OpenAPI, WSDL / SOAP, HAR, or a Postman collection. It is the same import form offered as the Import kind in the Mocks composer; see Import for the full list of formats and what MockServer creates from each.
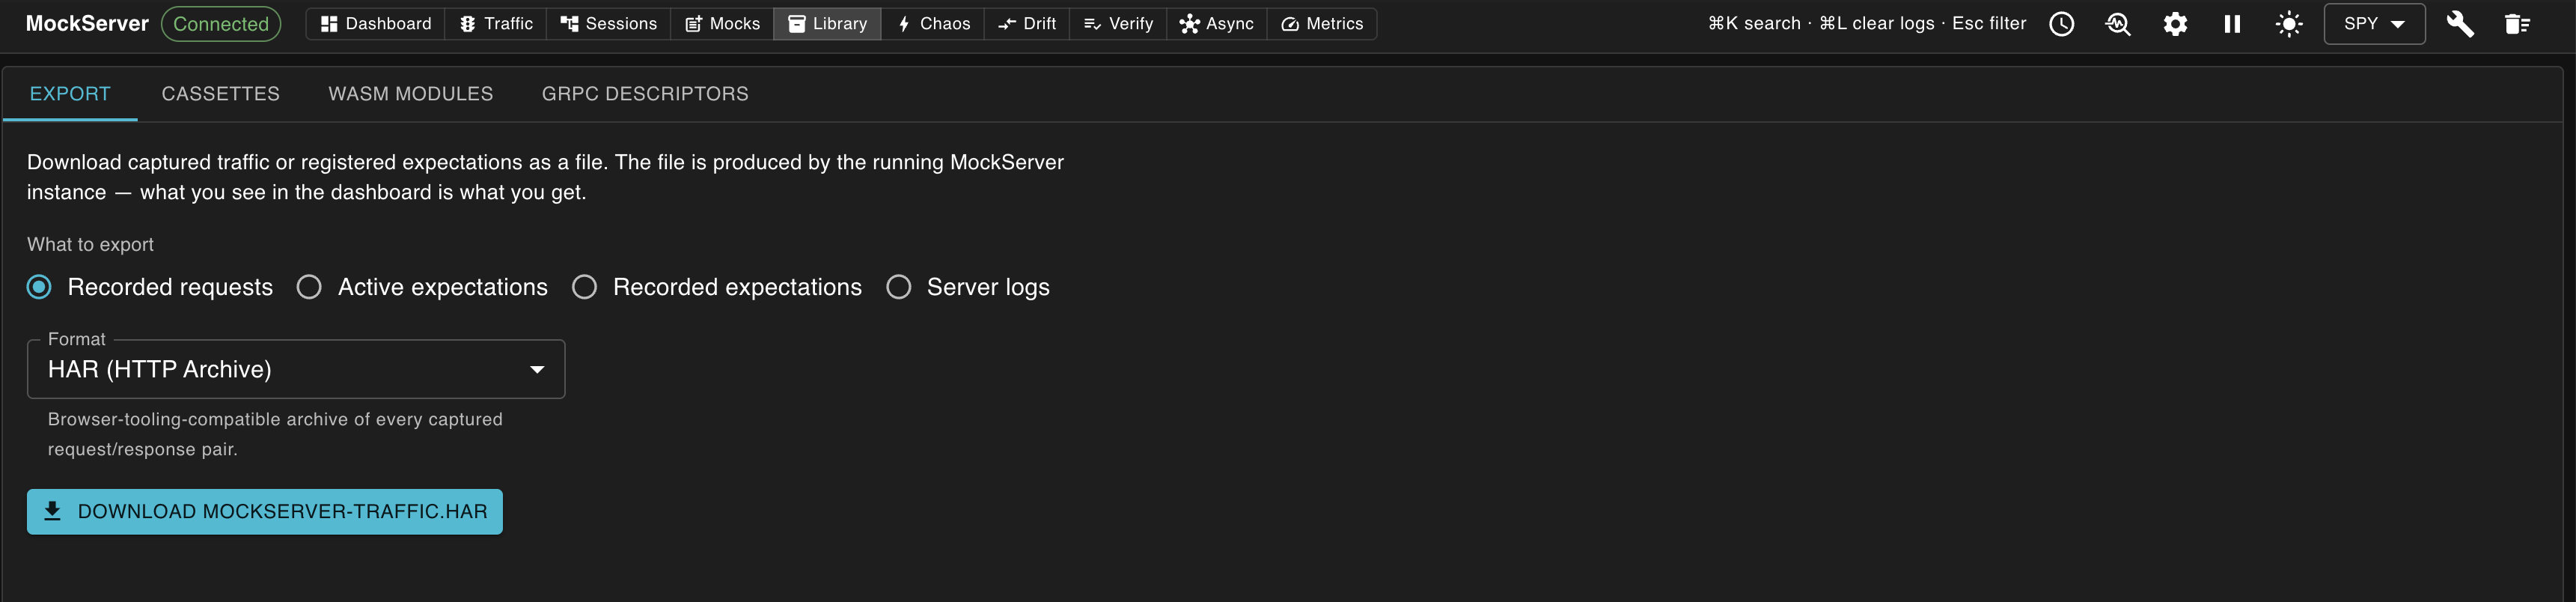
Export
The Export sub-tab lets you download captured content from the running MockServer instance. Pick what to export and the format, then click Download. The What to export options cover four scopes — recorded requests, active expectations, recorded expectations, and server logs — and the format dropdown filters itself to the formats valid for the scope you pick. A few formats apply to only one scope:
| Format | Contents | Re-importable into |
|---|---|---|
| MockServer JSON | Round-trippable JSON in MockServer's own expectation format. | MockServer (PUT /mockserver/expectation or load_expectations_from_file). |
| MockServer Java DSL (expectations only) | Java code using the MockServer DSL that recreates each expectation. | A JUnit test or MockServer Java client — paste the code in directly. |
| HAR (HTTP Archive) | Each item as a request/response pair, in the standard HAR format. | Browser DevTools, HAR analysis tools, performance analysers. |
| OpenAPI 3 spec | One operation per (method, path) with the response body as an example. | Swagger UI, Redoc, code generators, API gateways. |
| Postman collection v2.1 | Each item as a Postman request with its example response. | Postman, Newman, Insomnia (via import). |
| Bruno collection (.zip) | One .bru file per request, plus a bruno.json manifest, packaged as a zip. | Bruno — unzip and open the folder as a collection. |
| Log entries (JSON) (requests only) | Raw MockServer log events for the captured request/response pairs (verbose JSON, mainly for debugging). | MockServer log tooling or manual inspection. |
| cURL commands (requests only) | One cURL command per captured request. | Any shell — paste in to replay the captured traffic. |
OpenAPI, Postman, and Bruno exports are best-effort: positive-string matchers round-trip cleanly, but MockServer's NottableString negation, regex bodies, and dynamic actions (forward / template / callback / error / LLM) appear as placeholder text since those formats describe client requests + example responses rather than full mock-server expectation graphs. Use MockServer JSON when you need a lossless round-trip.
Cassettes
The Cassettes sub-tab manages JSON cassette files — snapshots of the current MockServer state. A recorded cassette contains all captured LLM/MCP traffic as mock expectations, with sensitive headers (API keys, auth tokens, cookies) automatically redacted. The file can be committed to version control and loaded in tests for deterministic, offline replay. It has four inner tabs:
- List — a table of tracked cassettes showing filename, path, expectation count, last used, and origin (recorded or loaded), each with a delete action.
- Record — record a new cassette file, with optional request-path and host filters, via the
record_llm_fixturesMCP tool. - Load — load expectations back from a server-side JSON file via the
load_expectations_from_fileMCP tool. - Export — download the cassette metadata as JSON.
WASM Modules
The WASM Modules sub-tab uploads and manages WASM custom-rule modules. Give the module a name, choose a .wasm file, and click Upload; a table lists the uploaded modules, each with a delete action. Uploaded modules become available as the WASM module body-matcher type in the Mocks composer.
gRPC Descriptors
The gRPC Descriptors sub-tab uploads a compiled protobuf FileDescriptorSet (.desc, .pb, .bin, or .protoset) so MockServer can decode gRPC traffic. After uploading, the view lists the services it contains, each method with its input → output message types, and the streaming mode (unary, client, server, or bidirectional). Use Clear all to remove the loaded descriptors.
Drift
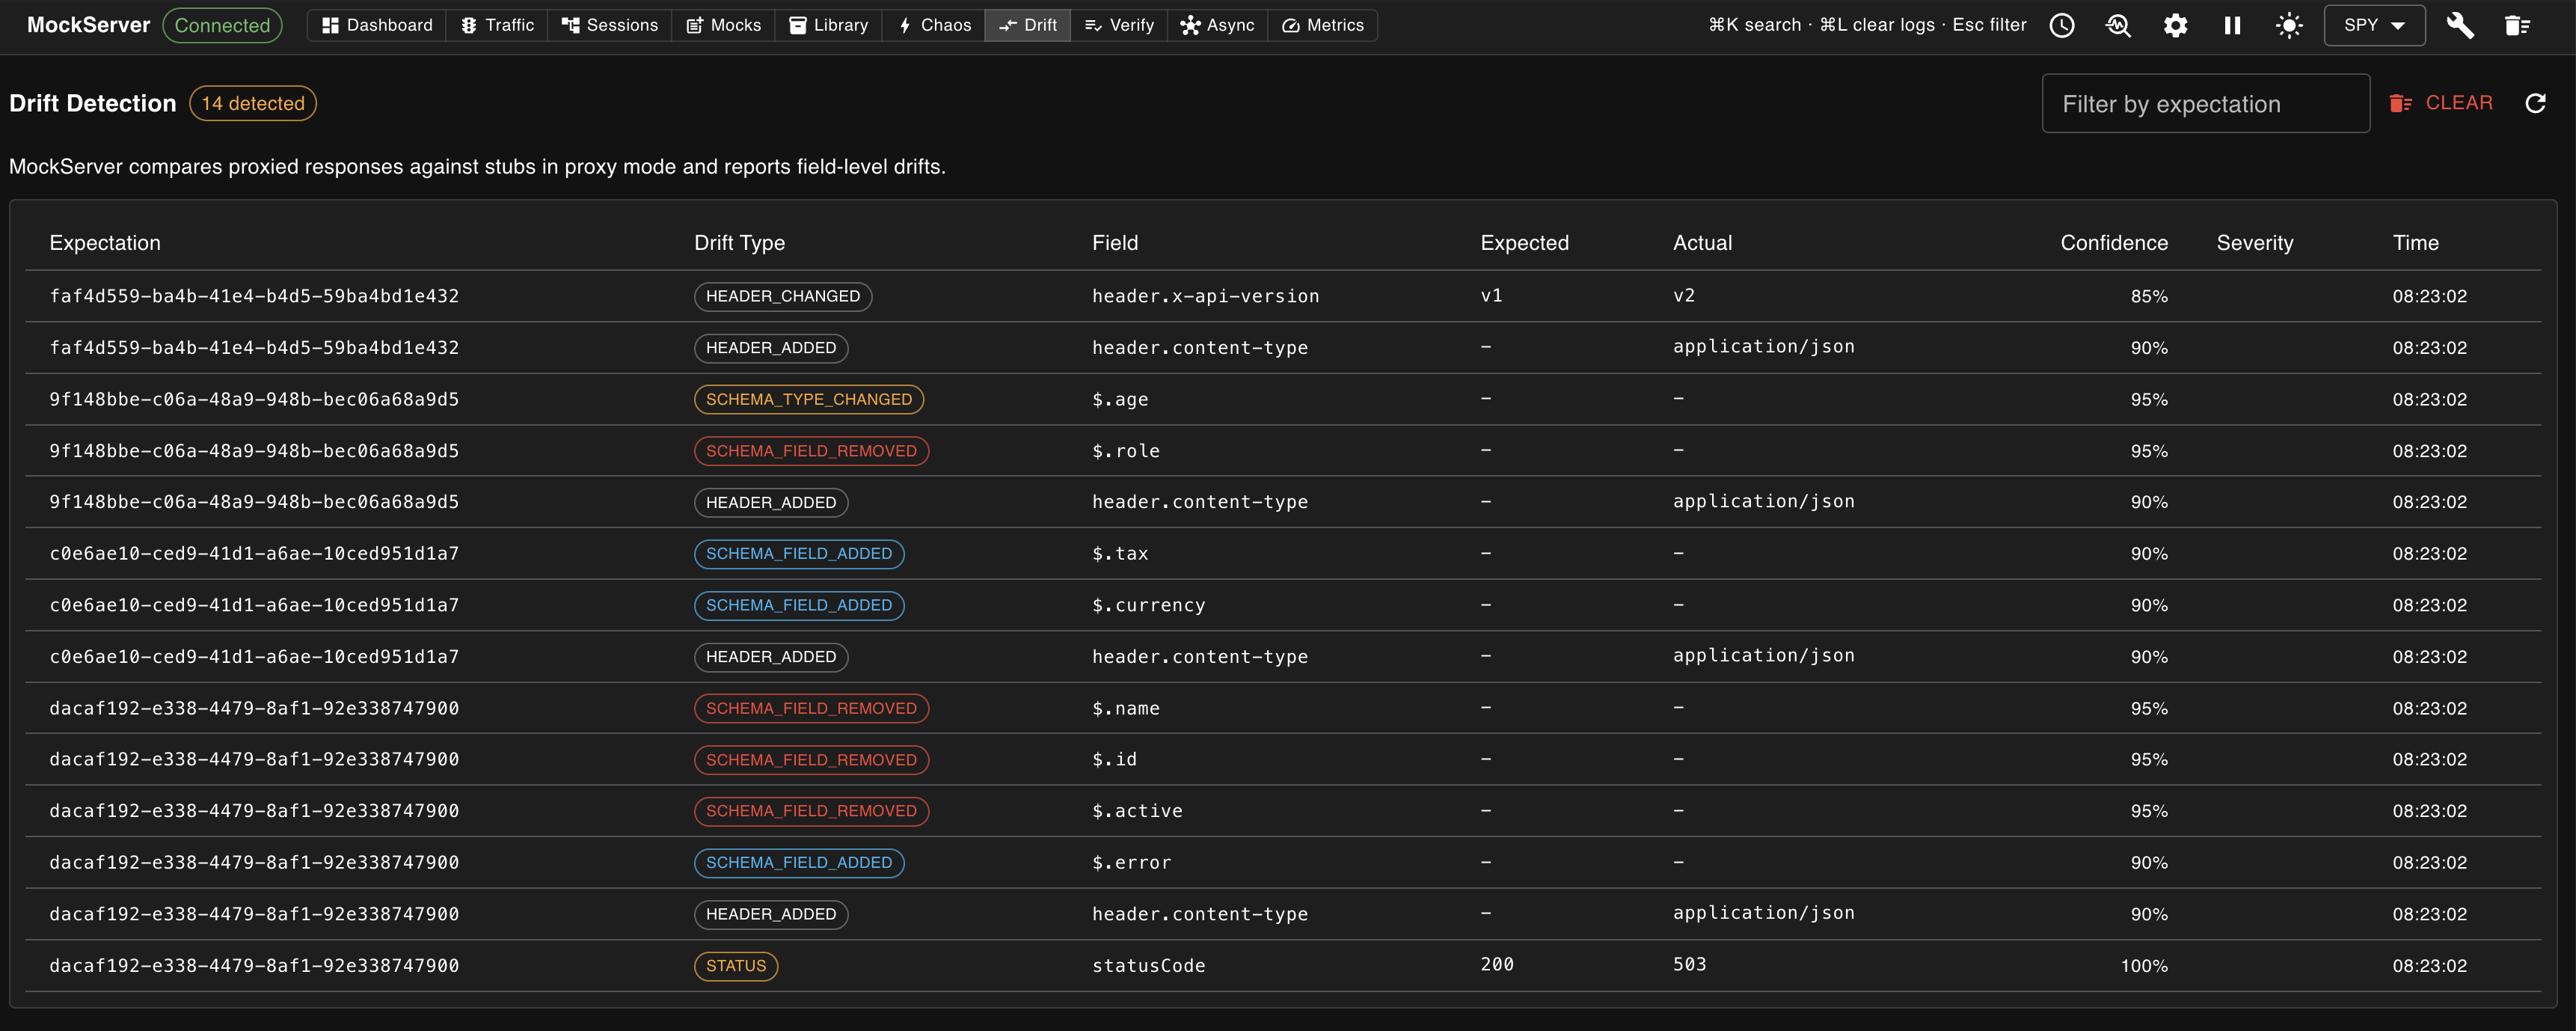
The Drift view surfaces mock drift — where a stubbed response no longer matches what the real upstream returns. When MockServer proxies a request that also has a matching response expectation, it compares the two and records any differences. Each row shows the affected expectation, the drift type (status, schema field added/removed, schema type changed, or header added/removed/changed), the field, the expected vs actual values, a confidence score, and the time. Filter by expectation, or use Clear to reset the recorded drift. This makes it easy to spot stubs that have silently fallen out of sync with the services they stand in for.
Verify
The Verify view lets you assert — straight from the dashboard — that MockServer actually received the requests you expected, without writing any test code. It checks against the requests MockServer has already recorded: a pass means it happened, and a failure shows the closest matching requests and the actual count so you can see what went wrong. Switch to it using the Verify button in the navigation bar.
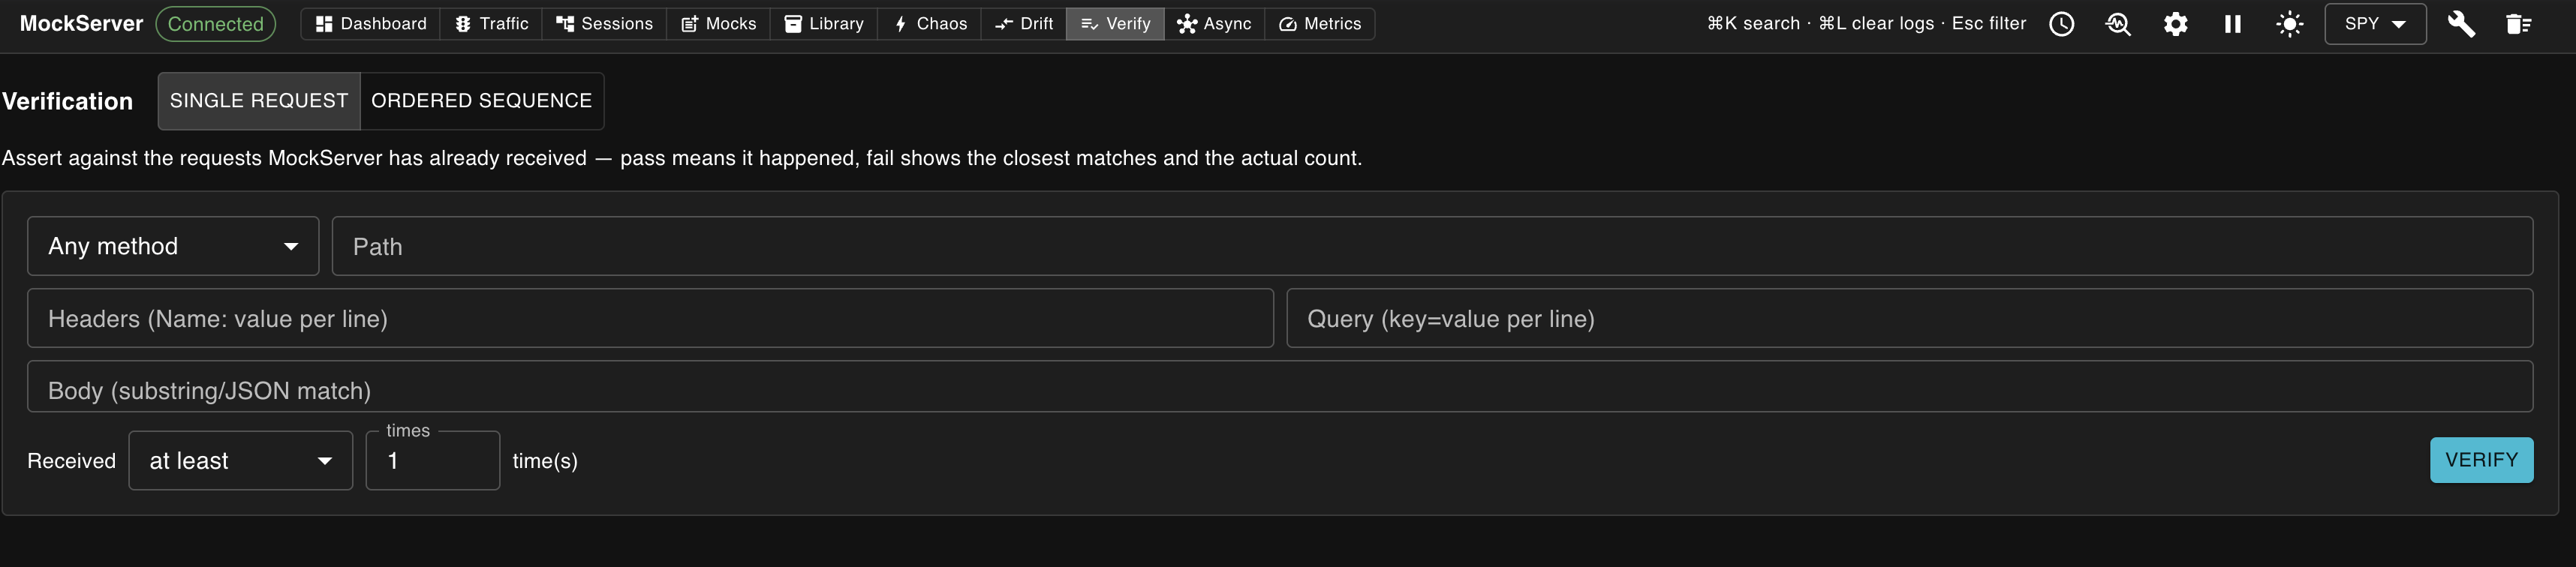
A toggle at the top picks one of two modes:
- Single request — describe one request to match (Method, Path, Headers, Query parameters, Body), then assert how many times it was received: at least, at most, exactly, or between two counts. Click Verify to run the check.
- Ordered sequence — describe two or more requests that must have been received in this order (other requests may occur in between). Add or remove steps as needed, then click Verify sequence.
Each request matcher accepts the same fields as the rest of MockServer: a method, a path, header name/value lines, query key=value lines, and a body to match as a substring or JSON. Leave a field blank to match any value. This is the visual equivalent of the verification API — handy for confirming, during exploratory testing, that a client made the calls you expected.
Contract
The Contract view runs an OpenAPI spec's operations against a live service and validates every response against the spec — contract testing without writing any test code. Switch to it using the Contract button in the navigation bar.
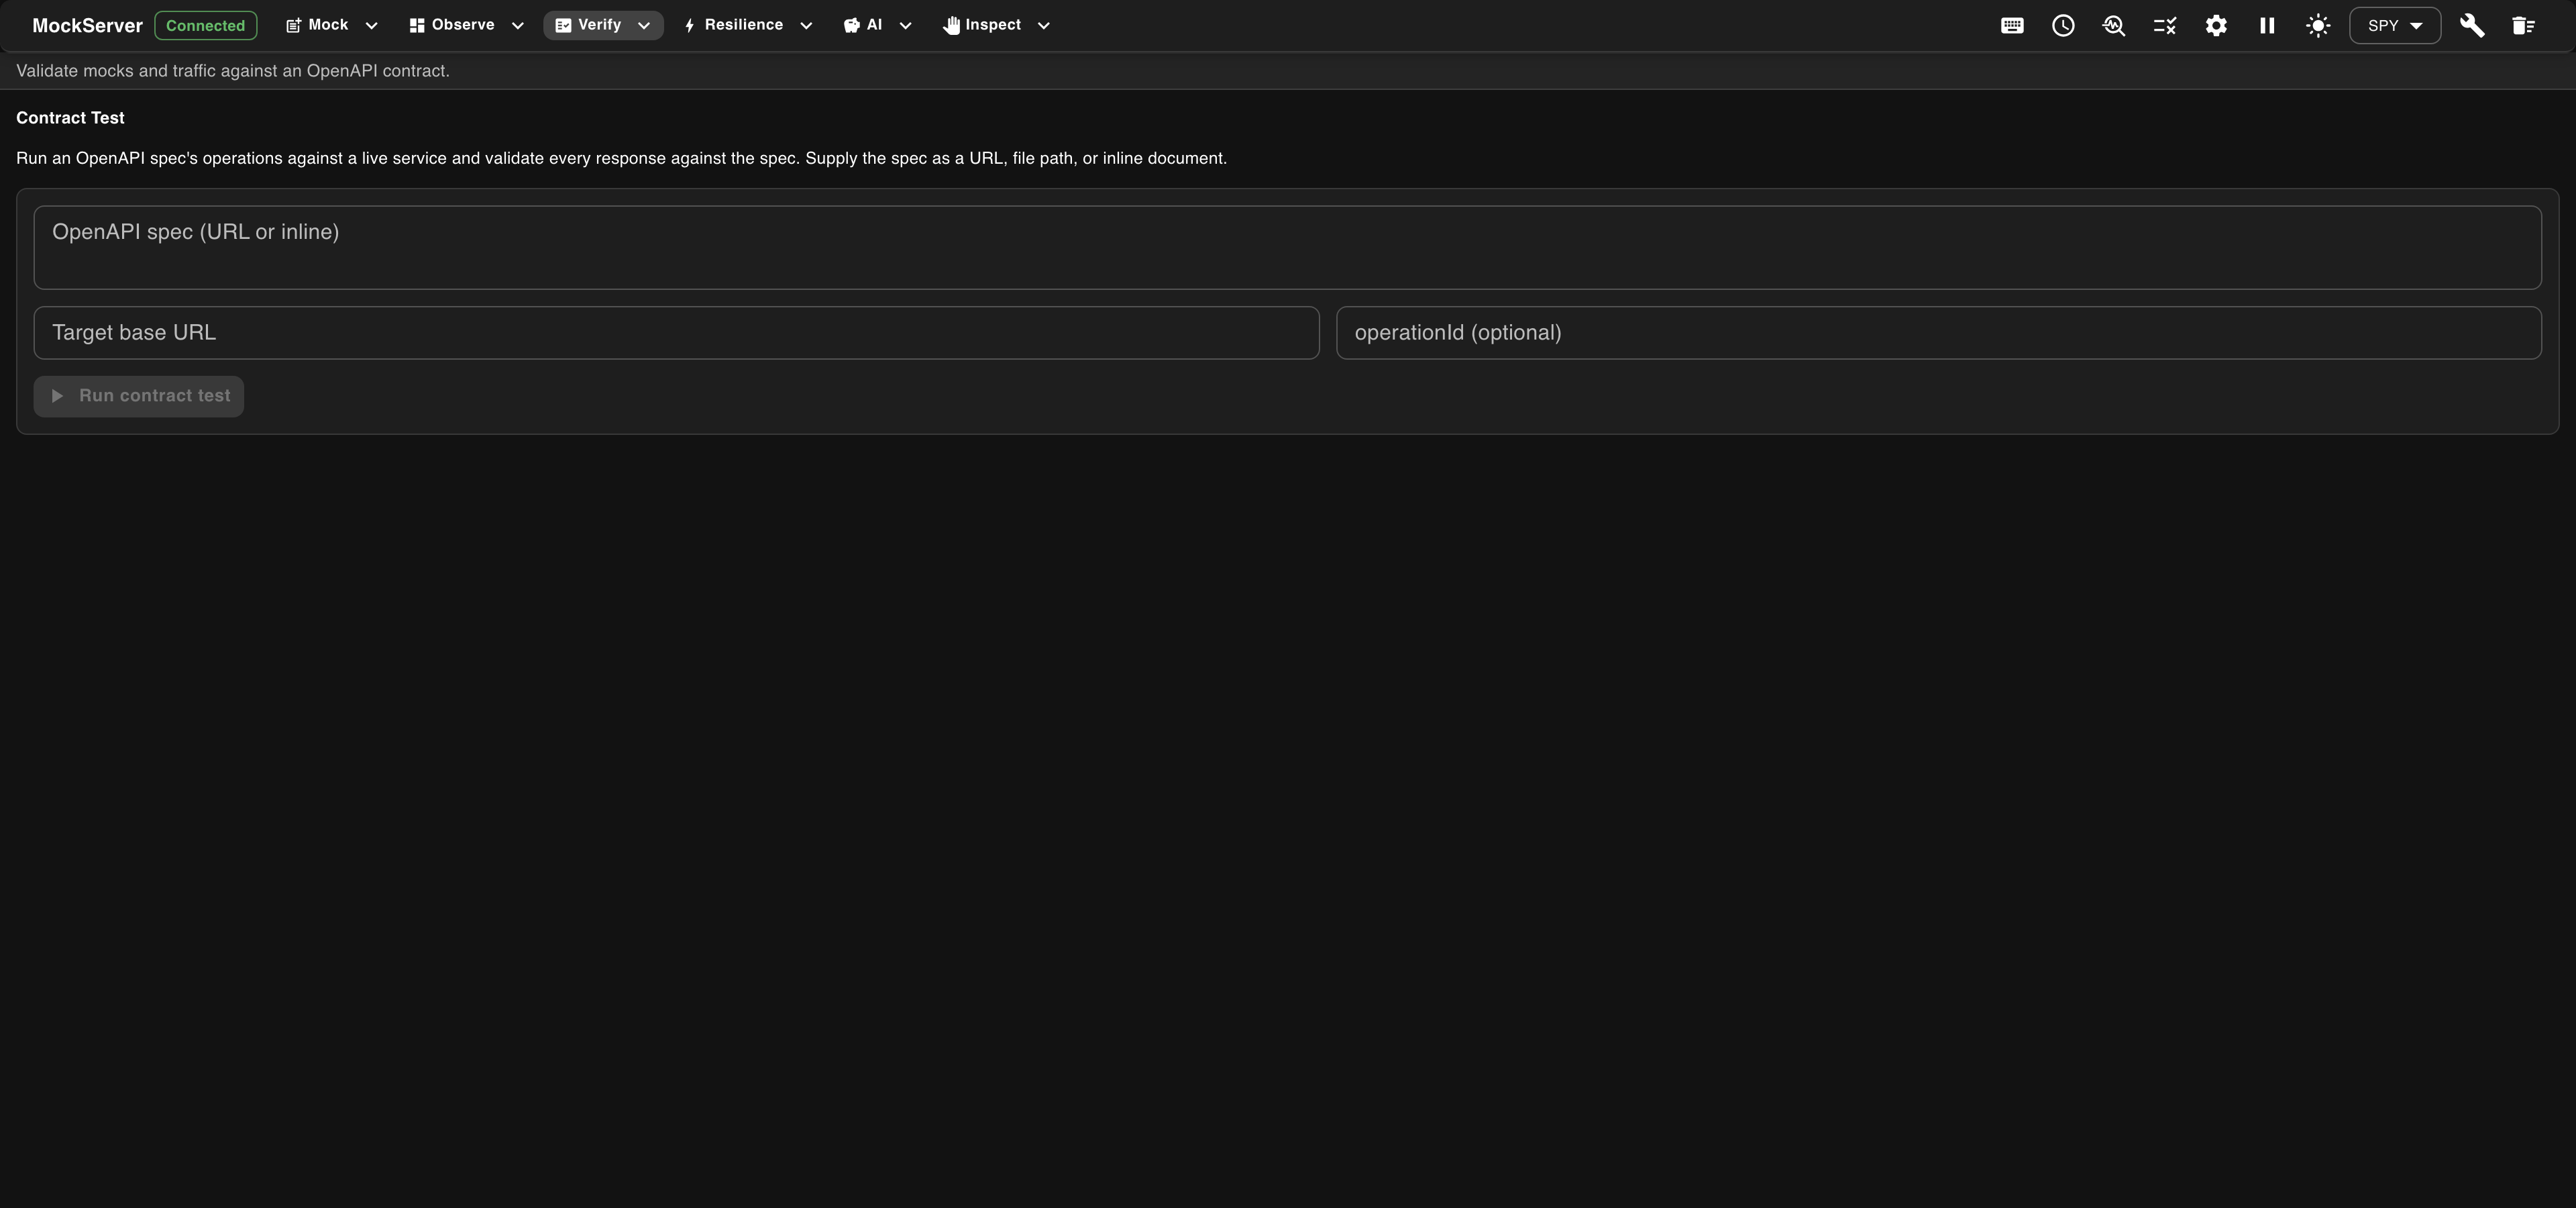
Supply the OpenAPI spec as a URL, file path, or inline document, set the Target base URL of the service to exercise, and optionally narrow the run to a single operationId. Click Run contract test and MockServer calls each operation and checks the responses (status, headers, and body schema) against the contract, reporting any violations. See Using OpenAPI for how MockServer works with OpenAPI specifications.
SLO
The SLO view lets you assert service-level objectives — latency percentiles and error rate — against the traffic MockServer has recorded, straight from the dashboard and without writing any test code. Switch to it using the SLO button (in the Verify group) in the navigation bar. Each objective compares an observed indicator against a threshold over a trailing window; every objective must hold for the check to PASS.
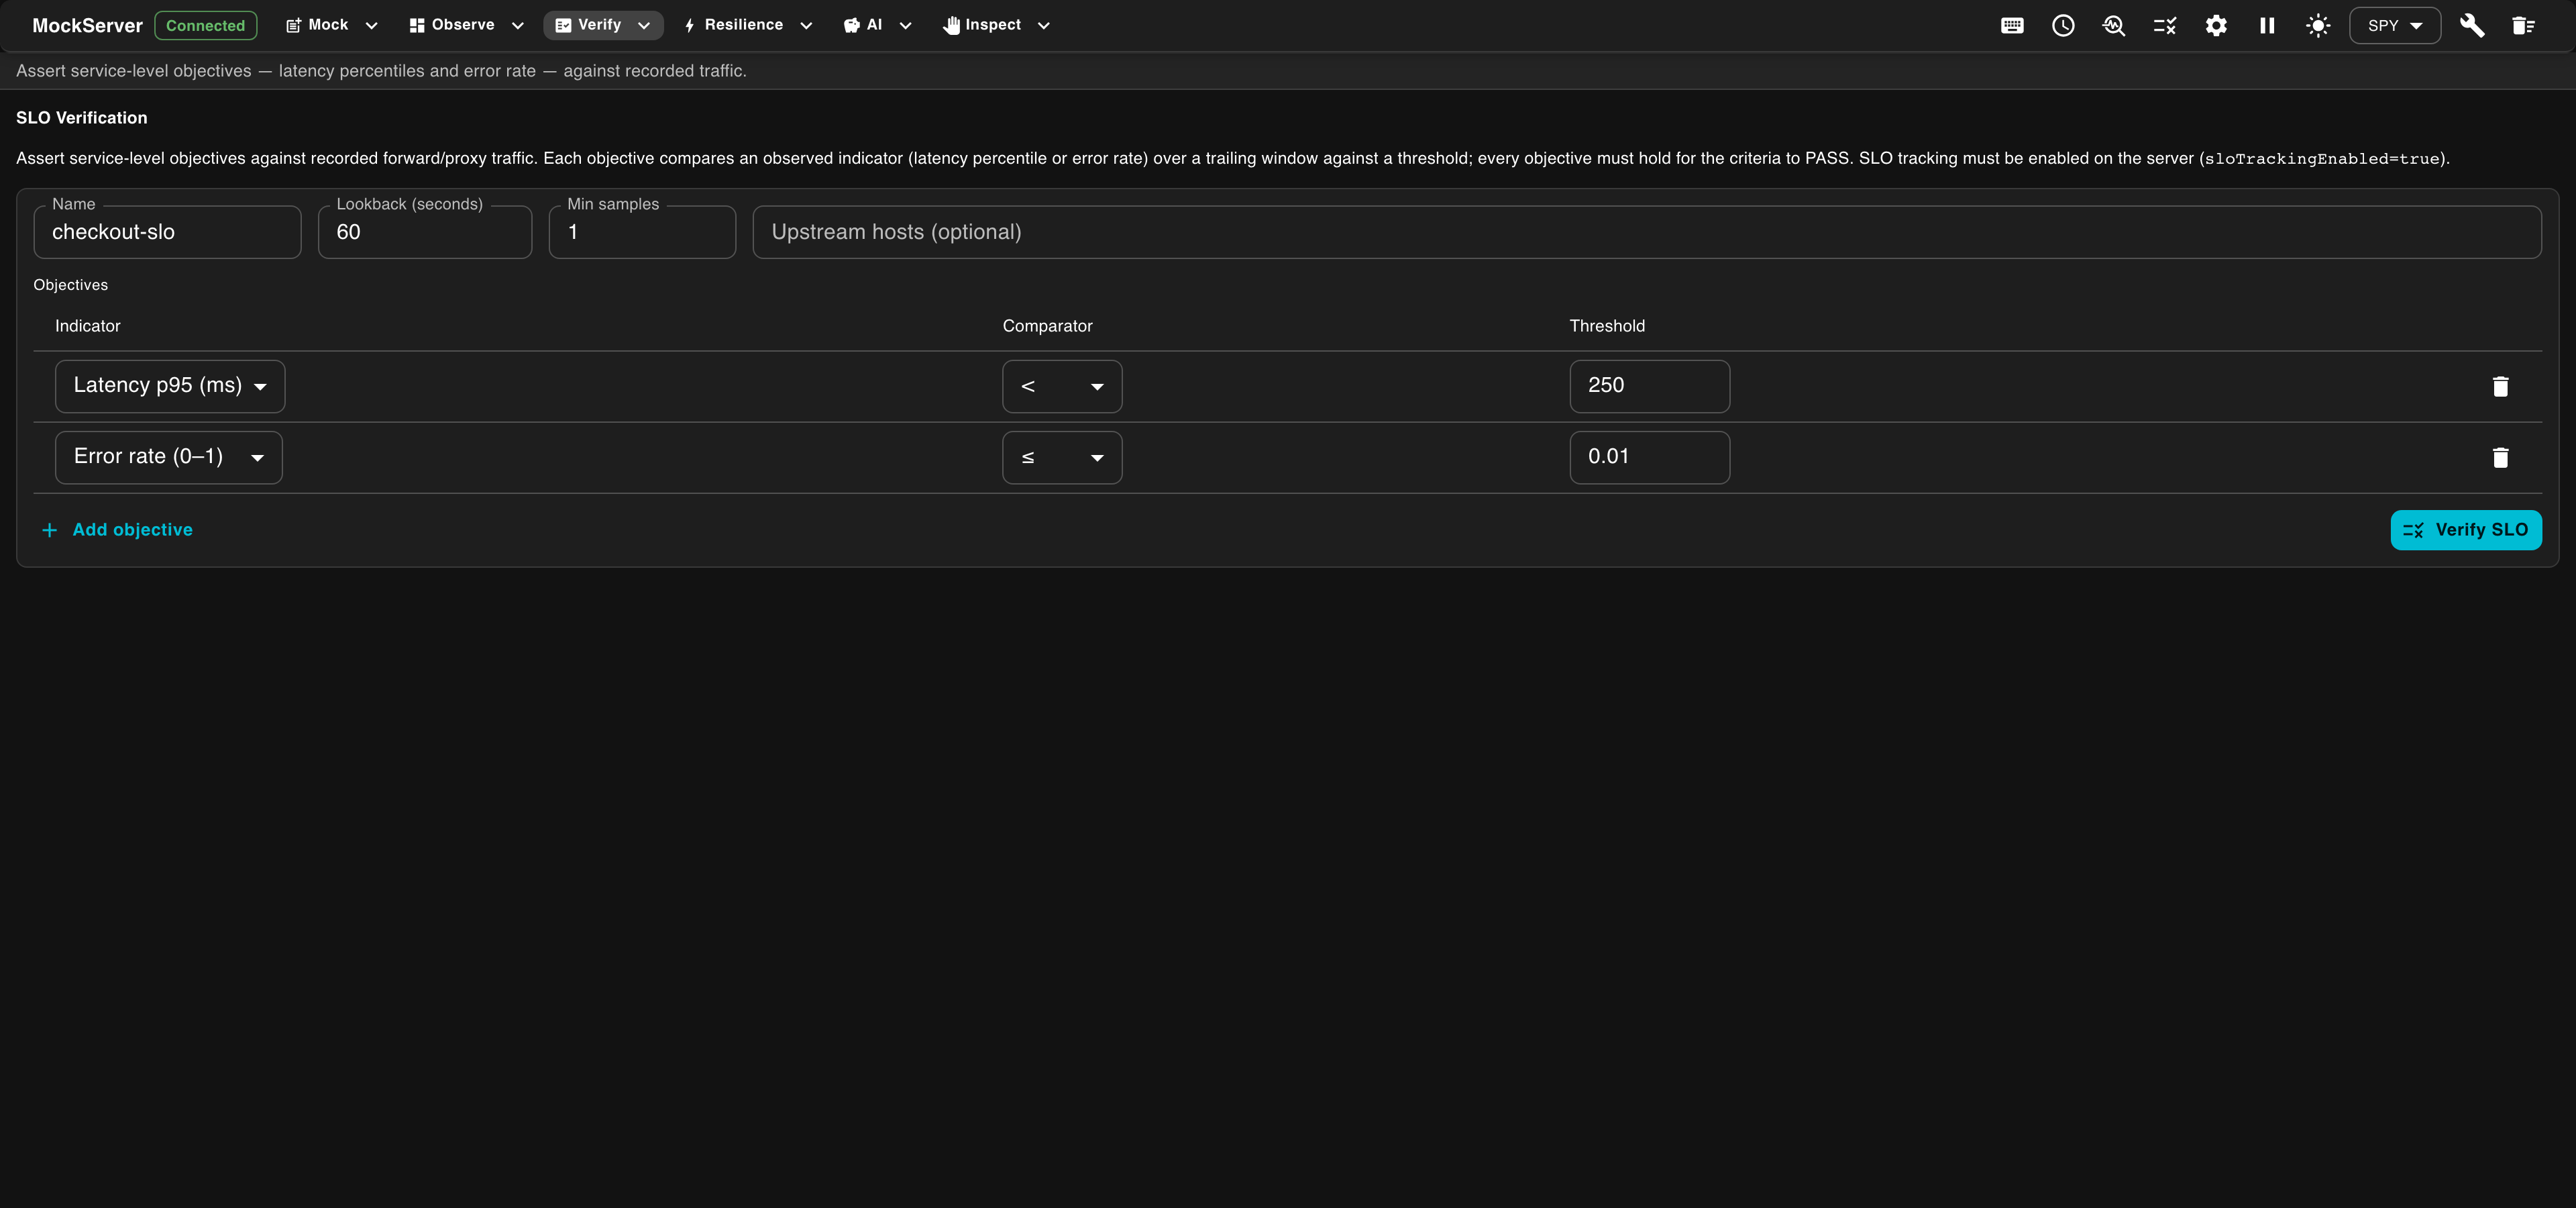
Give the SLO a Name, a Lookback window (seconds) and a minimum sample count, and optionally narrow it to specific Upstream hosts. Add one or more Objectives — each picks an Indicator (such as latency p95 in milliseconds, or error rate), a Comparator, and a Threshold. Click Verify SLO to evaluate every objective against recorded traffic and see which held and which breached. SLO tracking must be enabled on the server (sloTrackingEnabled=true).
Cluster
The Cluster view shows the state-backend cluster this MockServer node participates in. Switch to it using the Cluster button in the navigation bar. A standalone server reports a single local node; when MockServer is run with a shared (clustered) state backend, every member node appears here.
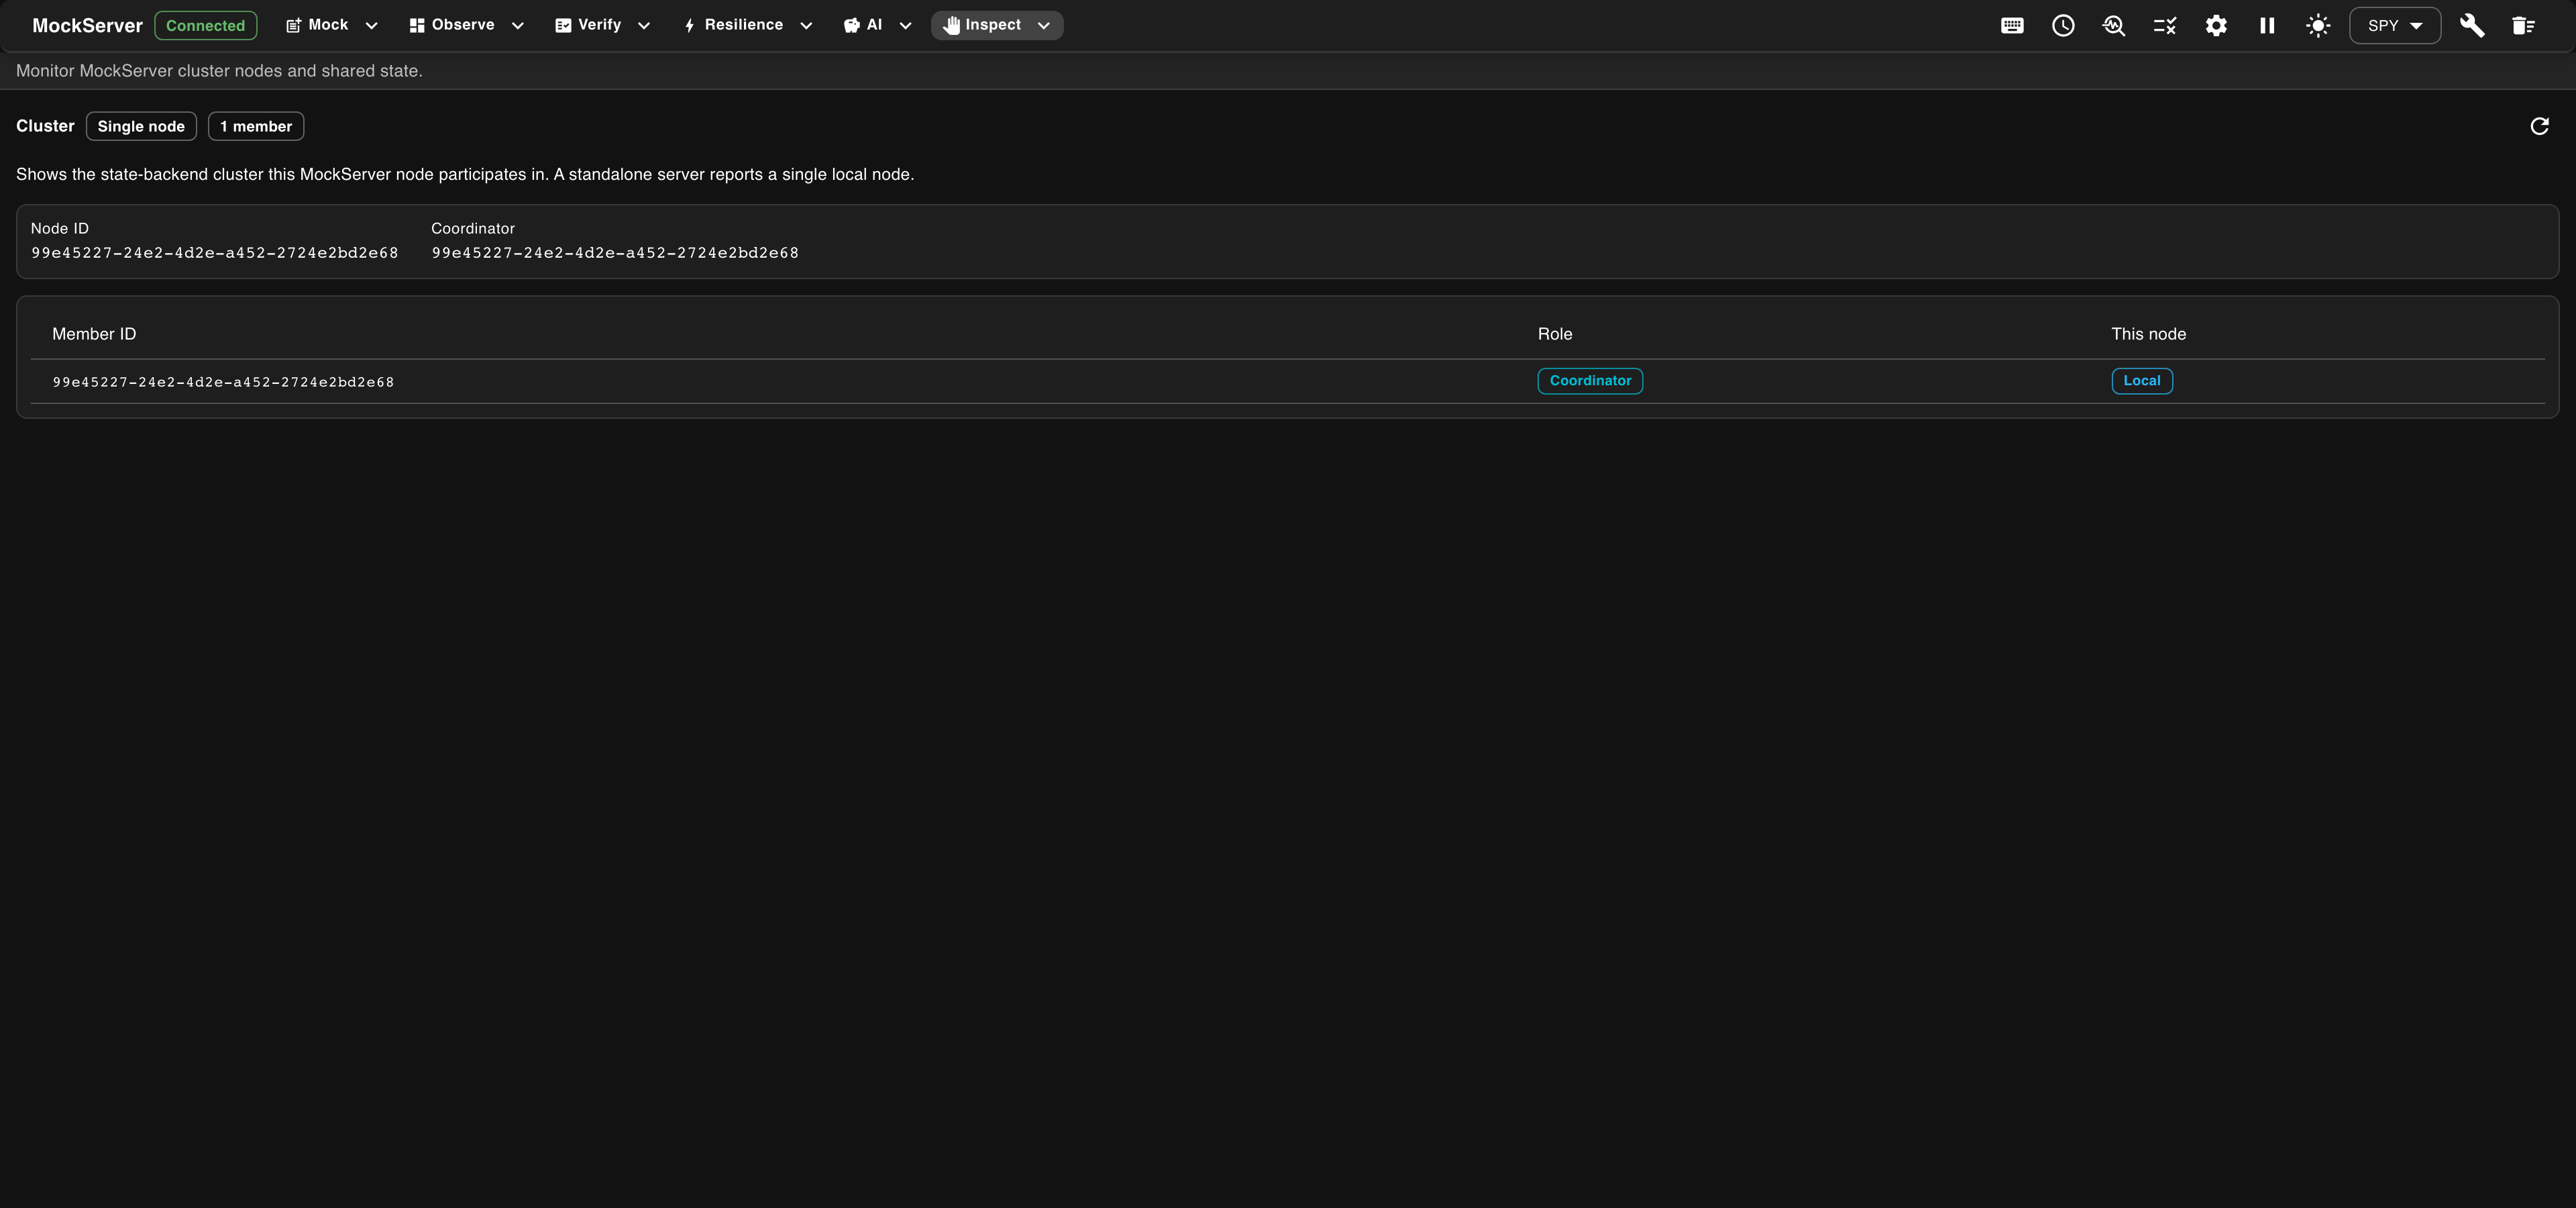
A status chip summarises the topology (for example, Single node with a member count). The view shows this node's Node ID and the current Coordinator, followed by a table of cluster members — each member's id, its Role (such as Coordinator), and which row is the local node. This makes it easy to confirm cluster membership and which node is coordinating shared state.
Metrics
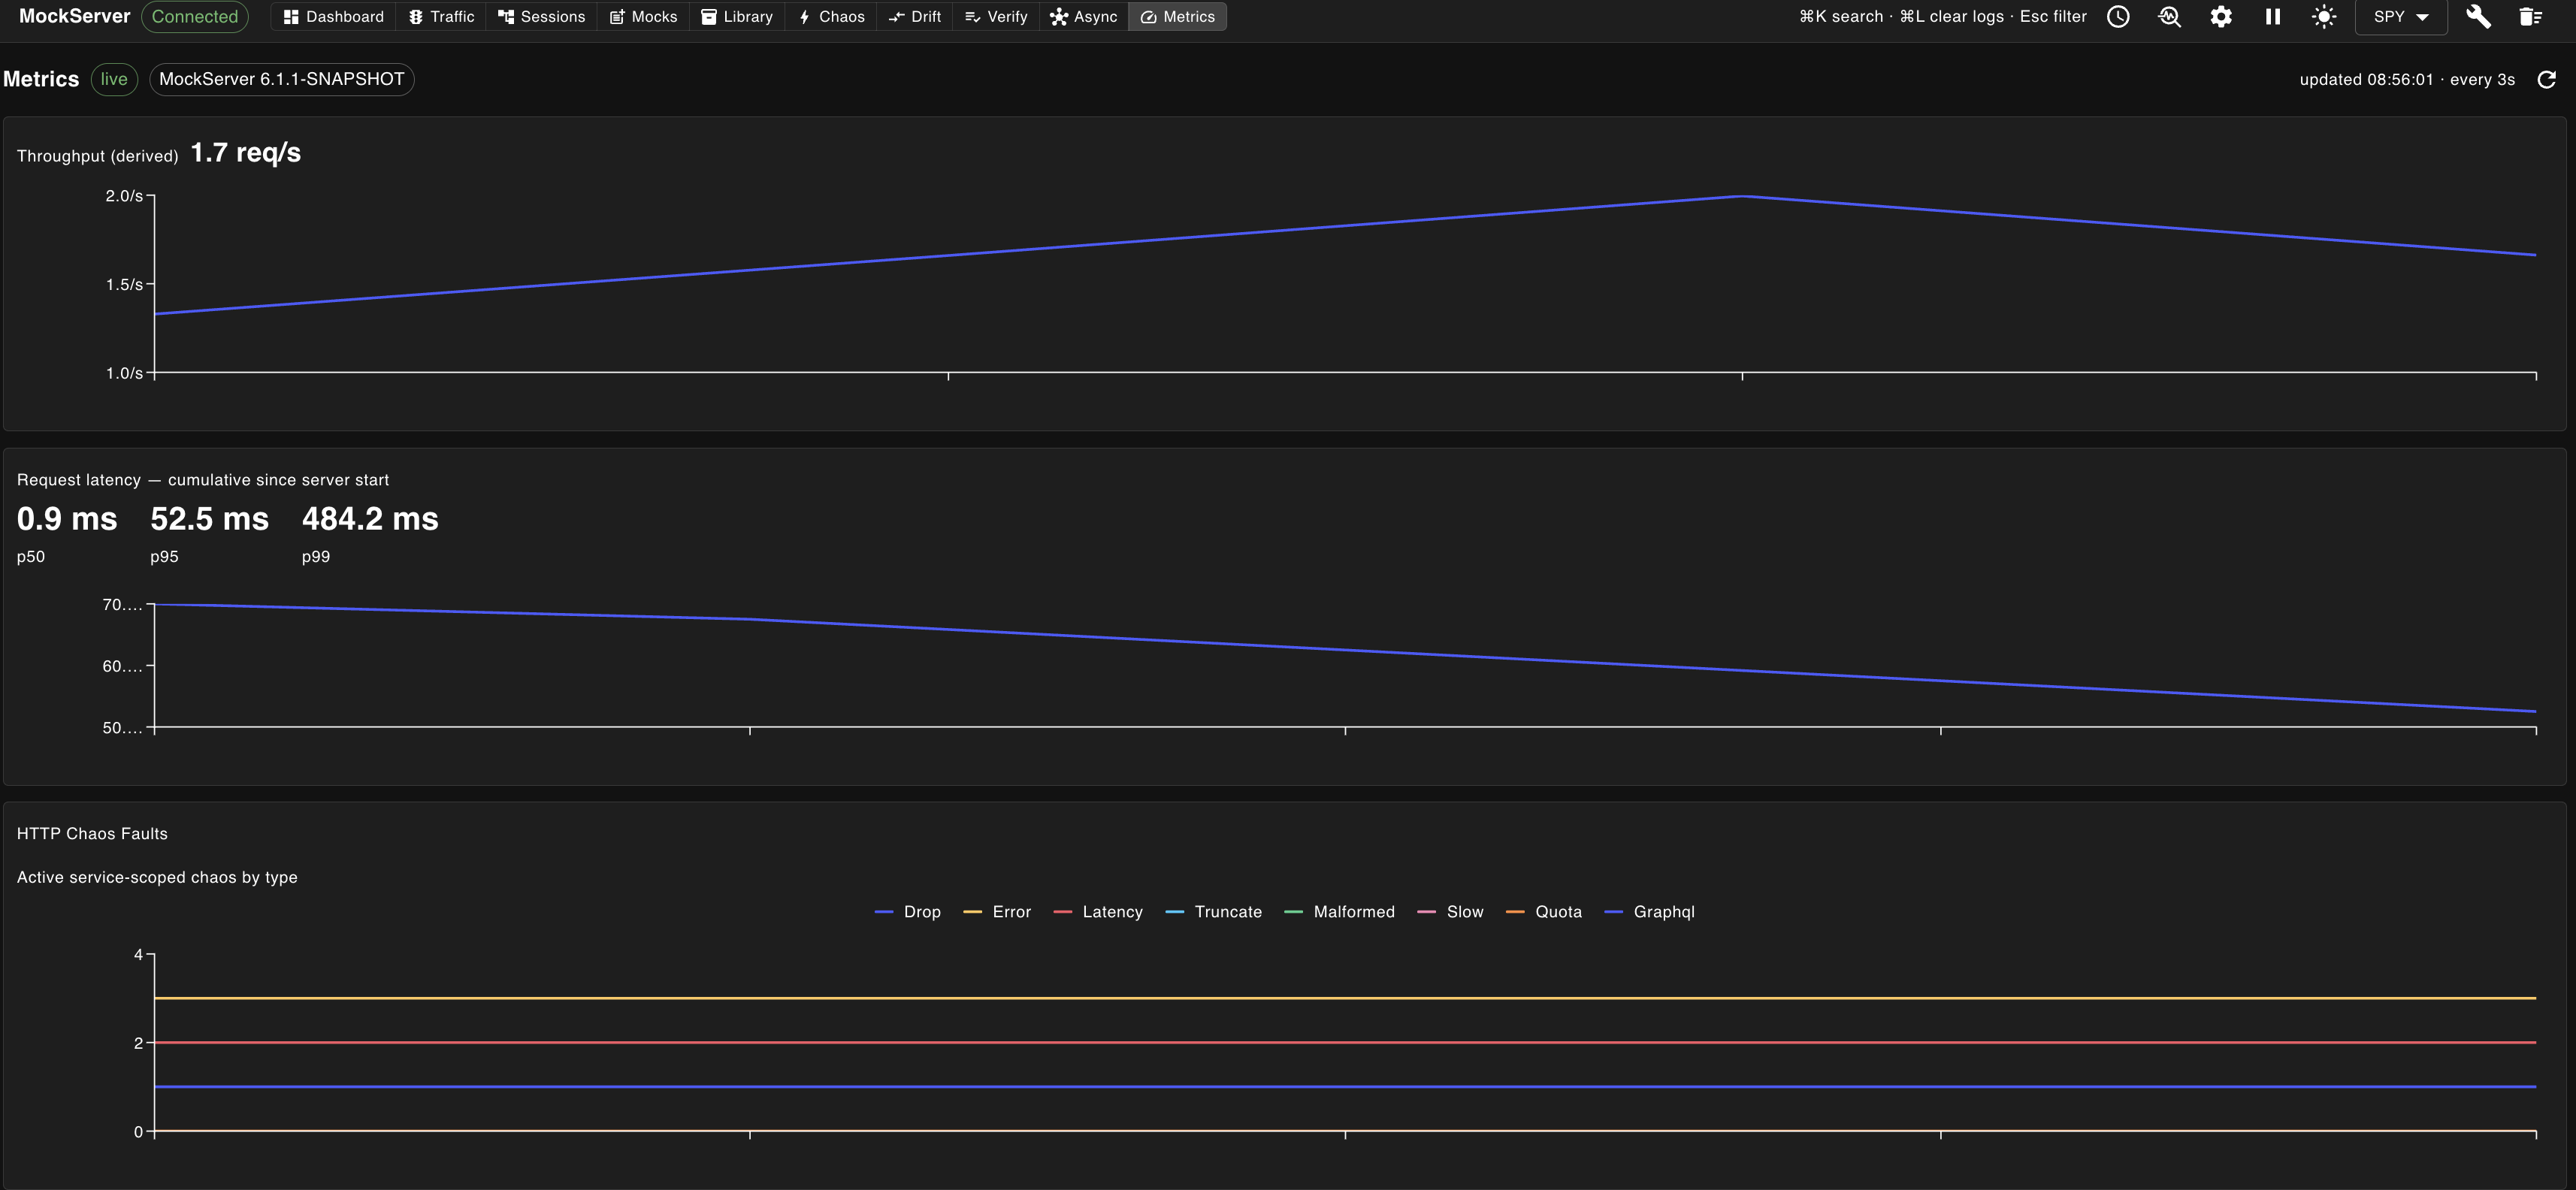
The Metrics view charts MockServer's own runtime metrics. It is only populated when metrics collection is enabled (configuration property metricsEnabled / MOCKSERVER_METRICS_ENABLED); otherwise the view shows Metrics are disabled with the flag and environment variable needed to turn them on.
When enabled, the view shows:
- Throughput — a derived requests-per-second figure with a trend chart.
- Request latency — p50, p95, and p99 response-time percentiles, derived from MockServer's request-duration histogram.
- HTTP Chaos Faults — injected faults broken down by type, plus the currently active service-scoped chaos (see the Chaos view).
- Request activity and Actions executed — cumulative request and action counters over time.
- Expectations by type — the number of active expectations broken down by action type (one line per type), and MCP tool calls per tool.
- JVM heap memory and Threads & GC — heap used/committed, thread counts, garbage-collection totals, and related JVM runtime figures.