Load Injection Performance
A single MockServer instance injects tens of thousands of requests per second of outbound load, and because injection is independent per instance you scale far beyond that by running N instances in parallel — aggregate injected throughput grows near-linearly, into the hundreds of thousands of requests/sec, by simply adding instances.
| Page | Question it answers |
|---|---|
| Scalability & Latency | How much traffic can one instance serve as a mock? |
| Load Injection | How do I drive load from MockServer? |
| Load Injection Performance | How much load can MockServer inject, and how does it scale? |
This page is about MockServer as a load generator — how much outbound traffic its built-in Load Scenarios can inject into a target, and how to scale that injection. (For how much traffic a single instance can serve as a mock, see Scalability & Latency.) A single instance is a self-contained, bounded load generator; to drive much more load you run many instances together and aggregate their metrics. Jump to how injection performance is measured for the methodology, or reproduce it from the harness at mockserver-performance-test/stack/inject/.
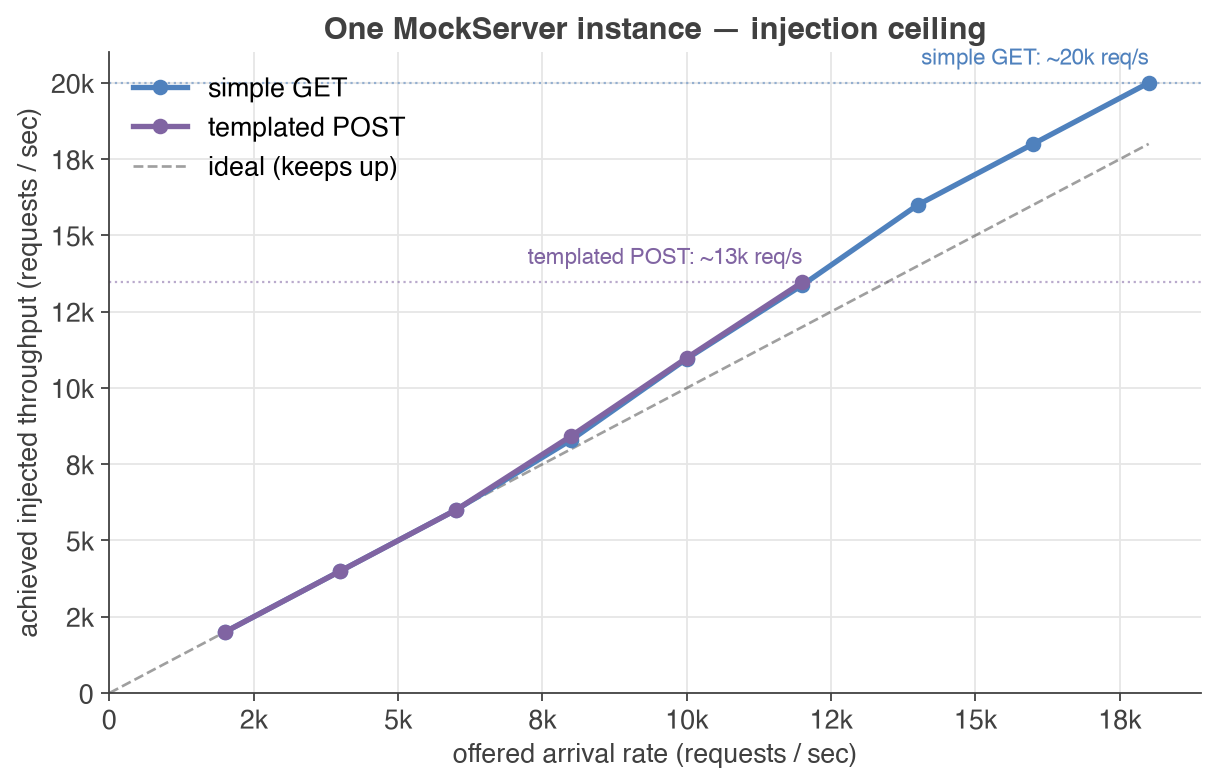
- Per-instance ceiling: with its safety caps raised, one instance saturates at a per-instance injection ceiling — about 20,000 simple requests/sec (a single GET) or 13,500 templated requests/sec (a 1 KB Velocity-templated POST with a feeder) on this box. Past that ceiling, offered arrival rate no longer translates into more injected throughput (see the per-instance ceiling chart).
- It is dispatch-bound, not CPU-bound — so size by instances: a single instance uses only about 1–2 CPU cores at its ceiling and hit the same ~18–20k at 1, 2, 4 and 8 cores, so giving one instance more cores does not raise its throughput. Allocate modest cores per instance (~2) and add throughput by adding instances — see how many instances you need.
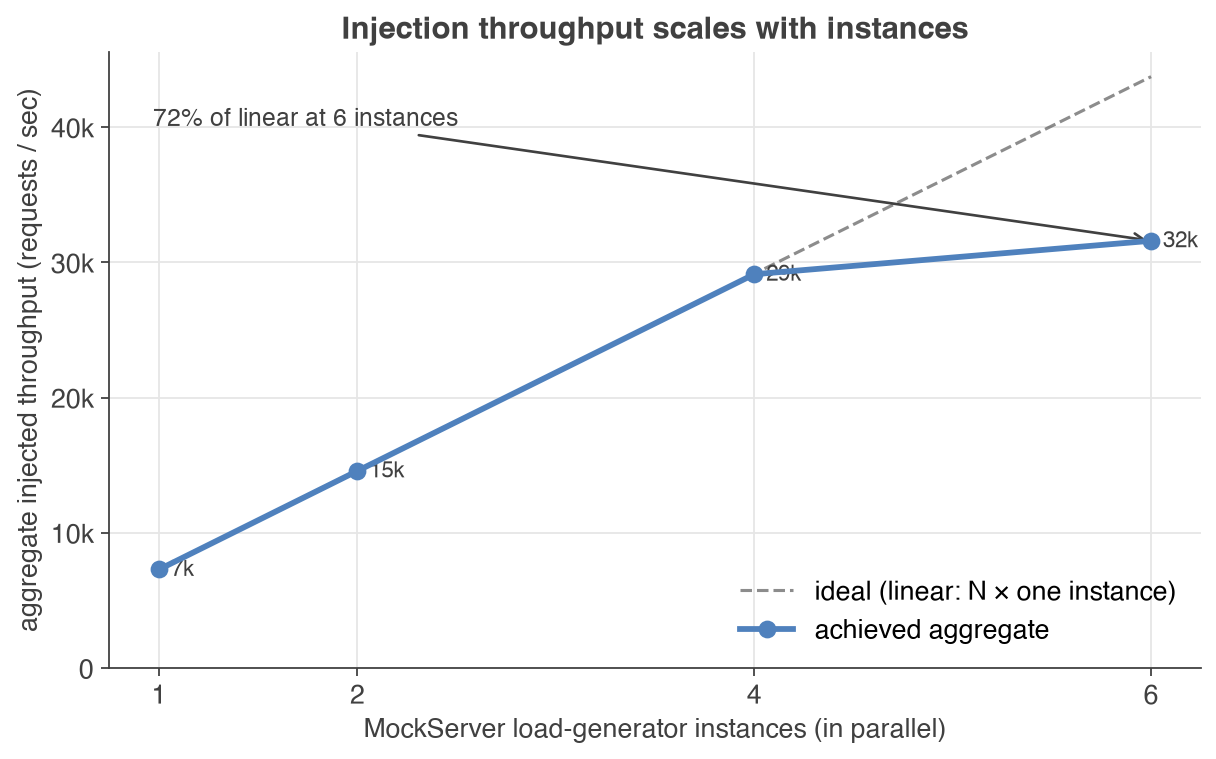
- Scales by adding instances: injection is independent per instance, so running N instances in parallel on the same scenario multiplies injected throughput near-linearly — close to N× the per-instance rate to about N=4 on one host, then bending as the host's cores, NIC and shared sink saturate (one box tops out around 30,000 req/s aggregate). Spread injectors across machines or pods to reach the hundreds of thousands of requests/sec (see the aggregate scaling chart).
- Aggregate + target metrics give the full picture: each instance exposes
mock_server_load_*Prometheus metrics; scrape them all and aggregate byrun_idfor total injected RPS, and capture your system-under-test's metrics too so you can see what it actually absorbed (see scaling load injection across many instances).
Honest framing: there is no built-in cross-node coordinator — running many injectors in parallel is a deployment pattern you orchestrate (docker-compose, a Kubernetes Deployment with replicaCount: N, or a Job started together), not a turnkey feature. MockServer makes each instance a capable, observable injector; you fan out the launch and aggregate the metrics. See caveats.
Performance at a glance
As you raise the offered arrival rate on a single instance, achieved injected throughput tracks it until the instance hits its per-instance ceiling, then plateaus — offering more arrival rate beyond that point does not inject more traffic, it just queues. The two lines are a simple GET, which tracks offered load up to about 20,000 req/s, and a heavier 1 KB templated POST, which does more work per request and so caps lower, at about 13,500 req/s. The instance reaches these ceilings using only about 1–2 CPU cores — the limit is its asynchronous dispatch path and the loopback to the sink, not whole-box CPU — which is why you scale by adding instances rather than cores. Those plateaus are the per-instance ceilings you scale out from:
Because each instance injects independently, aggregate injected throughput grows almost in step with the number of instances — the measured line tracks the ideal N× line closely up to four injectors (about 29,000 req/s, ~99% of linear), then bends at six as the single host's cores, shared sink and loopback NIC saturate. On one box you add capacity by adding instances up to that point; past it, spread injectors across machines or pods:
Scaling load injection across many instances
The architecture is deliberately simple: N MockServer instances each run the same load scenario against the same target, started together, each injecting up to its own per-instance ceiling. A Prometheus server scrapes every instance, and you aggregate the per-instance mock_server_load_* series into one total injected-RPS figure. The injectors do not talk to each other — there is no coordinator — so the only things you orchestrate are launch (start them together) and aggregation (sum their metrics). Four steps:
1. Raise the per-instance safety caps
A single instance is deliberately bounded by safety caps so the feature cannot self-DoS the server (see Safety Caps). To push injection throughput you raise them on purpose — the live caps that gate dispatch are the requests-per-second token bucket and the in-flight semaphore; the per-scenario caps gate validation:
# Raise the caps on every injector so one instance can push hard
docker run -p 1080:1080 \
  -e MOCKSERVER_LOAD_GENERATION_ENABLED=true \
  -e MOCKSERVER_METRICS_ENABLED=true \
  -e MOCKSERVER_LOAD_GENERATION_MAX_REQUESTS_PER_SECOND=100000 \
  -e MOCKSERVER_LOAD_GENERATION_MAX_RATE=100000 \
  -e MOCKSERVER_LOAD_GENERATION_MAX_IN_FLIGHT_REQUESTS=5000 \
  -e MOCKSERVER_LOAD_GENERATION_MAX_VIRTUAL_USERS=2000 \
mockserver/mockserver| Environment variable | Default | Why raise it for injection |
|---|---|---|
MOCKSERVER_LOAD_GENERATION_MAX_REQUESTS_PER_SECOND |
500 | Live token bucket at dispatch — the hard ceiling on injected RPS for the instance. Raise it above your target per-instance rate. |
MOCKSERVER_LOAD_GENERATION_MAX_RATE |
5000 | Maximum arrival rate (iterations/second) a RATE stage may request — raise it so the open-model stage is allowed to ask for the throughput you want. |
MOCKSERVER_LOAD_GENERATION_MAX_IN_FLIGHT_REQUESTS |
200 | Live in-flight semaphore — raise it so concurrency is not the bottleneck before CPU is. |
MOCKSERVER_LOAD_GENERATION_MAX_VIRTUAL_USERS |
50 | Maximum concurrent virtual users — raise it for higher-concurrency closed-model (VU) injection. |
These caps are safety limits you are deliberately relaxing, not performance switches. With them raised, the instance's own dispatch path becomes the bottleneck — which is exactly the per-instance ceiling you then scale out from by adding instances.
2. Deploy N injectors
Docker Compose — the inject harness at mockserver-performance-test/stack/inject/ brings up the injectors, the Envoy sink, and Prometheus together; scale the injector service to N replicas:
# From mockserver-performance-test/stack/inject/
docker compose up -d --scale injector=8 envoy prometheus
Kubernetes / Helm — run the injectors as a Deployment with N replicas, the raised caps as configuration, and trigger them with a REST fan-out:
# Deploy N injectors with raised caps (the MockServer Helm chart)
helm install injectors mockserver/mockserver \
  --set replicaCount=8 \
  --set 'env[0].name=MOCKSERVER_LOAD_GENERATION_ENABLED' --set 'env[0].value=true' \
  --set 'env[1].name=MOCKSERVER_METRICS_ENABLED' --set 'env[1].value=true' \
  --set 'env[2].name=MOCKSERVER_LOAD_GENERATION_MAX_REQUESTS_PER_SECOND' --set 'env[2].value=100000' \
  --set 'env[3].name=MOCKSERVER_LOAD_GENERATION_MAX_RATE' --set 'env[3].value=100000' \
  --set 'env[4].name=MOCKSERVER_LOAD_GENERATION_MAX_IN_FLIGHT_REQUESTS' --set 'env[4].value=5000' \
  --set 'env[5].name=MOCKSERVER_LOAD_GENERATION_MAX_VIRTUAL_USERS' --set 'env[5].value=2000'
3. Load the scenario on every instance and trigger a synchronized start
Load (register) the same scenario on every injector, then trigger them all together. A small shared startDelayMillis on the trigger means every instance begins its load at the same offset, absorbing the jitter of the fan-out so the injectors ramp as one. The scenario is an ordinary load scenario aimed at your target (or the Envoy sink for a calibration run):
# Fan out the SAME scenario to every injector (replace with your instance addresses)
INJECTORS="http://injector-0:1080 http://injector-1:1080 http://injector-2:1080"

SCENARIO='{
  "name": "inject-target",
  "startDelayMillis": 2000,
  "profile": { "stages": [ { "type": "RATE", "rate": 40000, "durationMillis": 120000 } ] },
  "steps": [
    {
      "request": {
        "method": "GET",
        "path": "/api/orders/$iteration.index",
        "headers": { "Host": ["target.svc:8080"] },
        "socketAddress": { "host": "target.svc", "port": 8080, "scheme": "HTTP" }
      }
    }
  ]
}'

# 1. LOAD (register) on every instance
for url in $INJECTORS; do
  curl -s -X PUT "$url/mockserver/loadScenario" \
    -H "Content-Type: application/json" -d "$SCENARIO" >/dev/null
done

# 2. TRIGGER all instances together — the shared startDelayMillis aligns the start
for url in $INJECTORS; do
  curl -s -X PUT "$url/mockserver/loadScenario/start" \
    -d '{ "name": "inject-target" }' >/dev/null &
done
wait
4. Aggregate by run_id in Prometheus, and capture the target too
Each instance exposes the mock_server_load_* family on GET /mockserver/metrics (needs metricsEnabled=true). The run_id label is a fresh UUID per trigger, so when Prometheus scrapes N instances together you can both distinguish each instance's run and aggregate across them. Total injected RPS for the scenario is the sum of the per-instance rates:
# Total injected requests/sec across ALL instances for one scenario
sum(rate(mock_server_load_requests_total{scenario="inject-target"}[1m]))

# Per-instance injected requests/sec — one series per instance via run_id
sum by (run_id) (rate(mock_server_load_requests_total{scenario="inject-target"}[1m]))

# Prove the injectors are not throttled (should be ~0 if caps are high enough)
sum(rate(mock_server_load_throttled_total{scenario="inject-target"}[1m]))
Counters are exposed with a _total suffix in Prometheus (so mock_server_load_requests is queried as mock_server_load_requests_total). Always capture metrics from the system under test alongside the injectors — injected RPS tells you what you sent, the target's own metrics tell you what it absorbed and how it behaved. See Observability & Metrics for the full metric catalogue and label set.
How injection performance is measured
The figures on this page are produced by an injection harness (mockserver-performance-test/stack/inject/) designed so that the injector is the provable bottleneck — otherwise you would be measuring the target, not the load generator. The principles:
- An absorbing sink. The injectors drive an Envoy
direct_responseendpoint that returns200immediately with no upstream call. The sink can absorb far more than the injectors produce, so any plateau in achieved throughput is the injector saturating, not the sink. - Caps raised out of the way. Every injector runs with the RPS, rate, in-flight, and virtual-user caps raised well above the target rate (see step 1), so the measured ceiling is the instance's own dispatch path, not a deliberate safety limit.
- The ceiling is dispatch-bound, not CPU-bound. Pinning one injector to 1, 2, 4 and 8 cores gave the same ~18–20k req/s ceiling at every core count, with the injector using only ~1–2 cores. The limit is the asynchronous (effectively single-threaded) dispatch loop plus the loopback to the sink — not whole-box CPU — so more cores per instance do not raise its throughput; more instances do.
- Throttle and error assertions. A run is only valid if
mock_server_load_throttled_total ≈ 0(the instance was not rate-limited or in-flight-capped) andmock_server_load_errors_total ≈ 0(no connection or timeout failures). A non-zero throttle count means a cap, not the dispatch path, was the bottleneck — the run is discarded. - Envoy cross-check. The traffic Envoy reports receiving is cross-checked against the traffic the injectors report sending (
mock_server_load_requests_total); the two must agree, confirming the injected count is real and nothing was silently dropped. - Scaling sweep. The aggregate-scaling chart is produced by repeating the single-instance calibration at 1, 2, 4, 8… instances against the same sink and plotting the summed injected RPS against the ideal N× line.
The harness is reproducible — bring up the injectors, the Envoy sink, and Prometheus from mockserver-performance-test/stack/inject/ and run the sweep yourself.
Measurement environment for the figures on this page: a single MockServer instance (current snapshot build) on a dedicated 16-vCPU CI host. To establish that injection is dispatch-path-bound, the per-instance ceiling was measured with one injector pinned to 1, 2, 4 and 8 cores in turn — it reached the same ~18–20k req/s at every core count while using only ~1–2 cores (and the Envoy sink ~1.2 cores). The scaling sweep then runs N lean two-core injectors in parallel. Every injector runs with the load-generation caps raised well above the target rate and the keep-warm forward connection pool enabled (forwardConnectionPoolKeepAlive=true) so connections to the sink are reused rather than churned. The target is an Envoy direct_response sink (negligible latency, far more capacity than the injectors produce) so the injector is the provable bottleneck, and Prometheus aggregates each instance's metrics by the run_id label. The run was clean through the ceiling — zero errors, zero throttle. Real-world throughput depends on your hardware, request complexity and target latency, so treat the shape (a per-instance dispatch ceiling, scale by adding instances, near-linear aggregate scaling until the host saturates) as the durable result and benchmark your own injectors on your own hardware.
Detailed results
Single-instance injection ceiling
Offered arrival rate against achieved injected throughput for a single injector with caps raised, driving the Envoy sink. Achieved throughput tracks the offered rate until the instance's dispatch path saturates, then plateaus at the per-instance ceiling. The simple GET tracks offered load to a ceiling of about 20,000 req/s; the heavier 1 KB templated POST does more work per request and so caps lower, at about 13,500 req/s. Throughout, the injector uses only about 1–2 CPU cores — and the ceiling was the same when the instance was pinned to 1, 2, 4 or 8 cores:
| offered rate (req/s) | achieved injected (req/s) | injector cores used | throttled | errors |
| 2,000 | 2,000 | ~0.2 | 0 | 0% |
| 4,000 | 4,000 | ~0.3 | 0 | 0% |
| 8,000 | 8,300 | ~0.7 | 0 | 0% |
| 12,000 | 13,400 | ~0.9 | 0 | 0% |
| 16,000 | 18,000 | ~1.1 | 0 | 0% |
| 18,000 | 20,000 (ceiling) | ~1.3 | 0 | 0% |
Simple GET. The 1 KB templated POST traces the same shape against a lower ceiling — representative points (offered→achieved): 2k→2.0k, 4k→4.0k, 6k→6.0k, 8k→8.3k, 12k→13.4k — saturating at about 13,500 req/s while still using only ~1–2 cores. Both runs held zero throttle and zero errors through the ceiling, so the plateau is the instance's dispatch path, not a cap, not whole-box CPU, and not a failing target. Because more cores per instance do not raise this ceiling, you scale by adding instances — see how many instances you need.
Aggregate scaling across instances
Summed injected throughput as the number of parallel injectors grows, each a lean two-core instance running the same simple-GET scenario against the same sink at a derived sustainable rate (about 7,300 req/s each), aggregated by run_id with zero errors:
| instances | aggregate injected (req/s) | per-instance (req/s) | vs ideal N× |
| 1 | 7,300 | 7,300 | — |
| 2 | 14,600 | 7,300 | ~100% |
| 4 | 29,100 | 7,275 | ~99% |
| 6 | 31,600 | 5,267 | ~72% |
Aggregate injected throughput grows near-linearly to four injectors (~29,100 req/s, ~99% of the ideal N× line), then bends at six (~31,600 req/s, ~72% of linear) as this single 16-vCPU box runs out of cores and its injectors contend for the shared sink and loopback NIC. That bend is a property of packing many injectors onto one host, not of MockServer's injection — to go further, fan out across machines or pods (the deployment pattern above), where each host carries its own near-linear band and the aggregate reaches the hundreds of thousands of requests/sec.
How many instances do you need?
A single instance injects up to about 20,000 req/s for a simple GET, or 13,500 req/s for a 1 KB templated POST — the peak on this hardware. Crucially, that ceiling is dispatch-path-bound, not CPU-bound: one instance reached the same ~18–20k at 1, 2, 4 and 8 cores while using only ~1–2 cores, so giving a single instance more cores does not raise its throughput. The unit you scale with is the instance: allocate modest cores per instance (~2) and add instances until you hit your target.
Aggregate throughput then grows near-linearly with the number of instances — about 7k each in the scaling run, giving N=2 = 14.6k, N=4 = 29.1k (~99% of linear), N=6 = 31.6k (~72%) as one box's shared cores, sink and loopback NIC saturate. One 16-vCPU box tops out around 30,000 req/s aggregate. For more — the hundreds of thousands of requests/sec — fan out across machines or Kubernetes pods (the deployment pattern above), many boxes each carrying their own ~30k band.
So size by counting instances, not cores:
instances ≈ desired_rps / per_instance_ratePer-instance throughput depends on contention: a lone instance peaks at ~18–20k, but packed alongside others on one host it settles lower — the scaling run sustained about 7,000 req/s each. As a planning rule of thumb, budget ~7,000–10,000 req/s per instance for a simple request (less for a heavier or templated one), ~1–2 cores each, then measure your fleet's aggregate and add instances until you hit the target:
# Total injected requests/sec across the whole fleet
sum(rate(mock_server_load_requests_total{scenario="inject-target"}[1m]))
Worked example — inject 100,000 req/s
For a simple request, plan roughly 10–14 instances at ~7–10k req/s each (about 20–28 cores total at ~2 cores per instance), spread across several machines — one 16-vCPU box saturates near 30k, so you need at least three or four boxes. Then verify empirically: watch the fleet aggregate (the query above) and add instances until it reaches 100,000. A heavier or templated workload injects less per instance (here ~13.5k peak versus ~20k for the simple GET), so it needs proportionally more instances for the same total — which is exactly why you size on your measured per-instance rate, not a headline number.
Measure your own scenario's per-instance rate
Our measurement is the simplest case. Real scenarios do more work per request — which lowers the per-instance rate and so raises the instance count you need. The things that push it down:
- larger or multiple request bodies;
- heavier templating (more Velocity logic, bigger rendered output);
- multi-step iterations, and captures or feeders that read and bind data per request;
- TLS to the target (encryption per connection and per request);
- real upstream latency — this one is special: latency raises the number of concurrent in-flight connections (
concurrency ≈ rate × latency), which drives memory and threads. Size the in-flight cap and heap for that concurrency as well as the instance count for the rate.
So don't guess your per-instance rate — measure it. Run your scenario through the same harness (mockserver-performance-test/stack/inject/), read the achieved mock_server_load_requests_total rate one instance sustains, and divide your target by it to get the instance count.
Keep the connection pool warm for high-rate injection
For high-rate injection, enable the keep-warm forward connection pool (forwardConnectionPoolKeepAlive=true) so the injector reuses connections to the target instead of opening a fresh one per request. Without it, a single instance churns connections to a fast target and caps at roughly 4,000 req/s — far below the dispatch ceiling — because connection setup, not request dispatch, becomes the bottleneck (the figures on this page were all measured with it on). The trade-off is more simultaneously open connections to the target, so size the target and any intermediaries accordingly; see Configuration Properties for the setting and its equivalent forms.
Caveats & honest limits
- The per-instance caps are deliberate safety limits. The defaults (
loadGenerationMaxRequestsPerSecond=500,loadGenerationMaxRate=5000,loadGenerationMaxInFlightRequests=200,loadGenerationMaxVirtualUsers=50) exist so the load feature cannot accidentally self-DoS a server that is also mocking traffic. The throughput on this page assumes you have raised them on purpose on dedicated injector instances. - There is no built-in cross-node coordinator. Running N injectors in parallel is a deployment pattern you orchestrate — MockServer does not elect a leader, shard the rate, or aggregate metrics for you. You start the instances together (docker-compose / a Kubernetes
DeploymentwithreplicaCount: N/ a Job) and aggregate theirmock_server_load_*series yourself in Prometheus byrun_id. - The target must out-scale the injectors, or you measure the target. The figures here use an Envoy
direct_responsesink precisely so the sink is never the bottleneck. Against a real system under test, the limiting factor is usually the target, not MockServer — which is the point of a load test, but means injected RPS and the target's served RPS can diverge. Always read both. - Figures are hardware- and scenario-dependent. The numbers on this page are measured on one pinned 16-vCPU CI box driving a local Envoy sink, for the simplest request shapes (a bare GET and a small templated POST). A single instance is dispatch-path-bound (more cores per instance do not raise its ceiling); aggregate throughput scales with the number of instances and with how well you spread them across hosts; and the per-instance rate falls as your requests get heavier (larger bodies, more templating, captures/feeders, TLS, real upstream latency). Treat the per-instance numbers as a starting point and measure your own scenario's per-instance rate before sizing a fleet.
Related Pages
- Load Injection (Load Scenarios) — how to build, run, and observe the load scenarios that this page scales out
- Scalability & Latency — how much traffic a single instance can serve as a mock (the other side of performance)
- Centralised Deployment — running MockServer as a cluster behind a load balancer for serving scale and high availability
- Chaos Testing & Fault Injection — inject faults alongside load to verify resilience under stress