MockServer Performance Benchmarks: Throughput & Latency
A single MockServer instance holds sub-millisecond median latency up to 32,000 requests/sec on six CPU cores, and request matching stays flat — up to 177× faster than a linear scan — as you scale to thousands of expectations.
| Page | Question it answers |
|---|---|
| Scalability & Latency | How much traffic can one instance serve as a mock? |
| Load Injection | How do I drive load from MockServer? |
| Load Injection Performance | How much load can MockServer inject, and how does it scale? |
MockServer is built for high throughput and low, predictable latency from a single instance. The figures below come from an automated performance suite that runs on a dedicated, core-pinned CI machine; every chart is regenerated from the measured data on each run, so what you see is reproducible rather than cherry-picked. Jump to how MockServer is performance tested for the methodology, or run the suite yourself from mockserver-performance-test/.
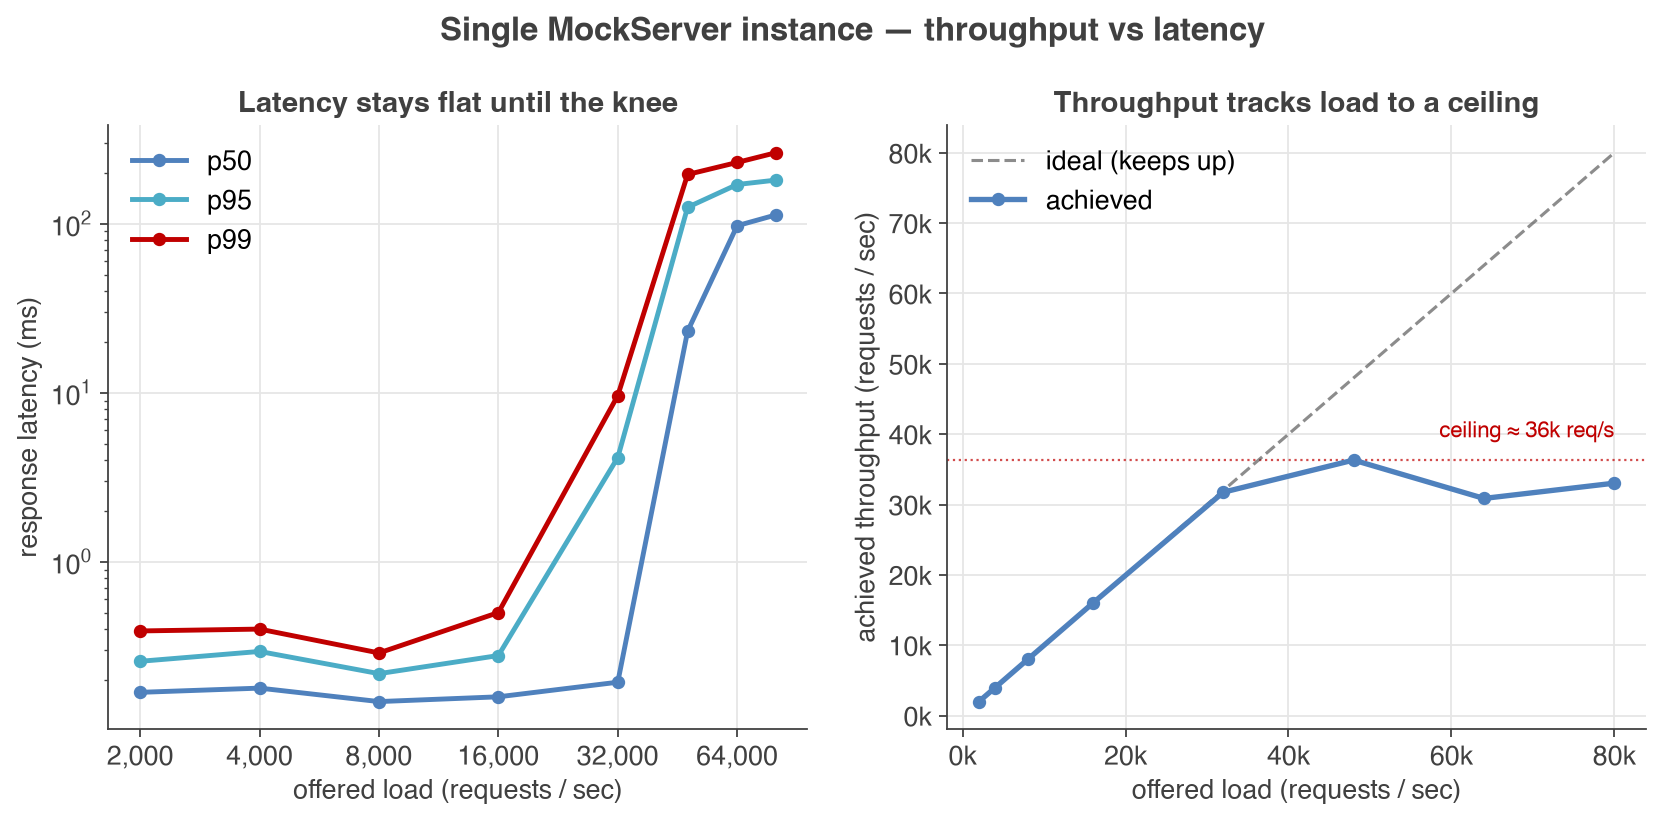
- Throughput & latency: on six CPU cores a single instance holds a sub-millisecond median with a p99 around half a millisecond all the way to 16,000 requests/sec, stays sub-millisecond at the median through 32,000 requests/sec, and saturates near 36,000 requests/sec — latency stays flat until that knee, then degrades gracefully (see the throughput vs latency chart).
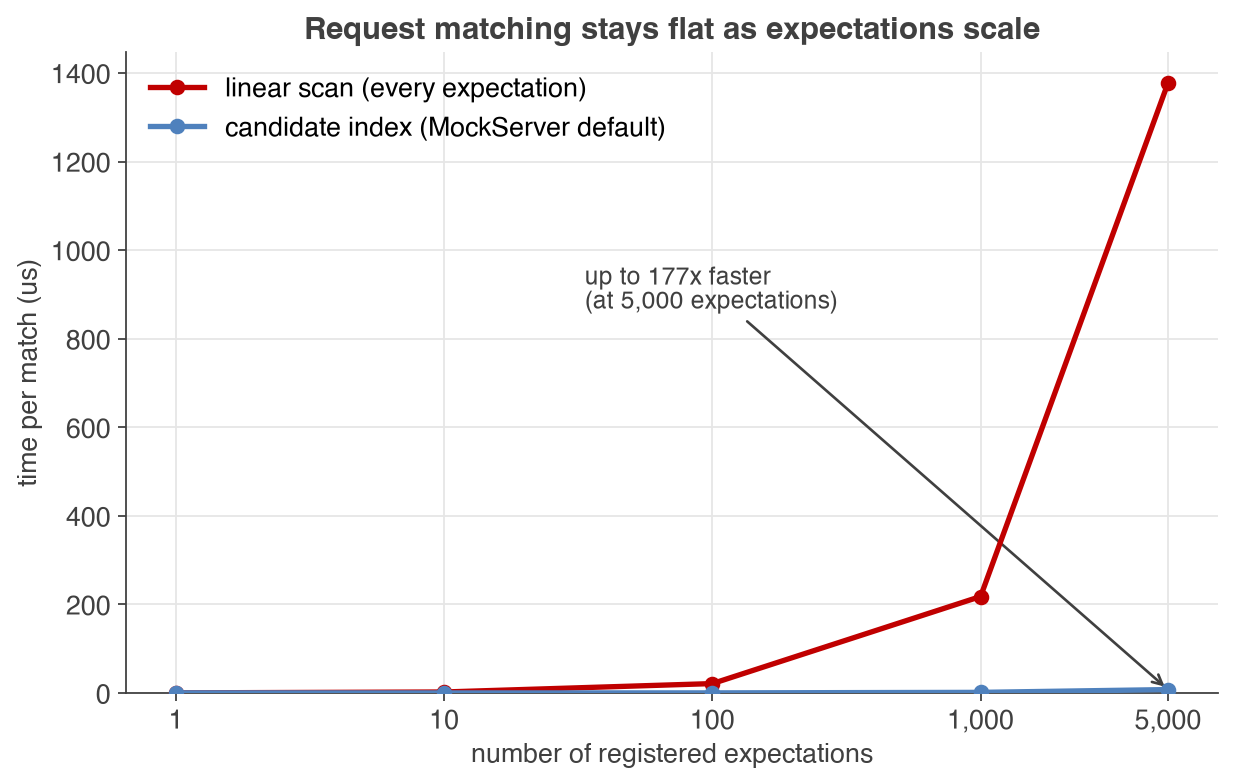
- Scales with expectations: request matching cost stays nearly flat as the number of registered expectations grows — up to 177× faster than a naive linear scan at 5,000 expectations — thanks to MockServer's candidate-matching index (see the matcher scaling chart).
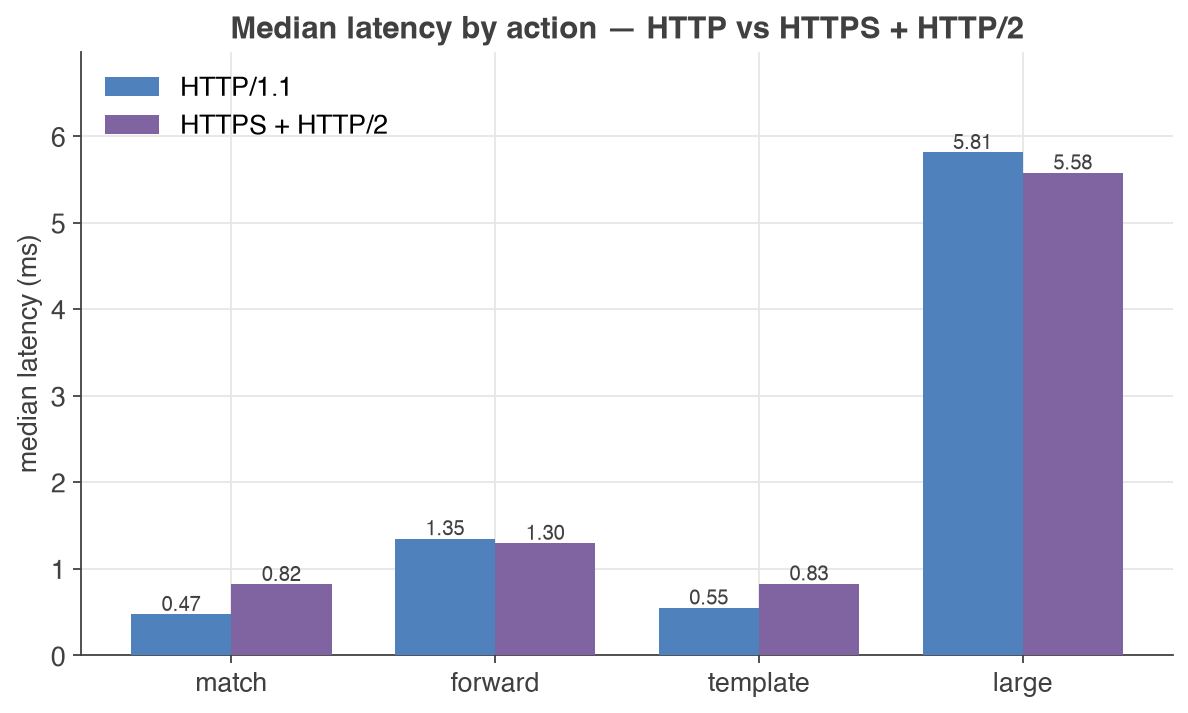
- Protocol coverage: HTTP/1.1, HTTPS and HTTP/2 are all served with low overhead, measured side by side on every run (see latency by action).
Performance at a glance
As offered load increases, achieved throughput tracks it almost exactly while latency percentiles stay flat — right up to the point the single instance saturates. That flat region is the headroom you can rely on; beyond it, latency rises predictably rather than collapsing.
Mock servers are often run with hundreds or thousands of expectations. MockServer keeps matching cheap at scale by narrowing each request to a small set of candidate expectations instead of testing every one. The difference grows with the number of expectations:
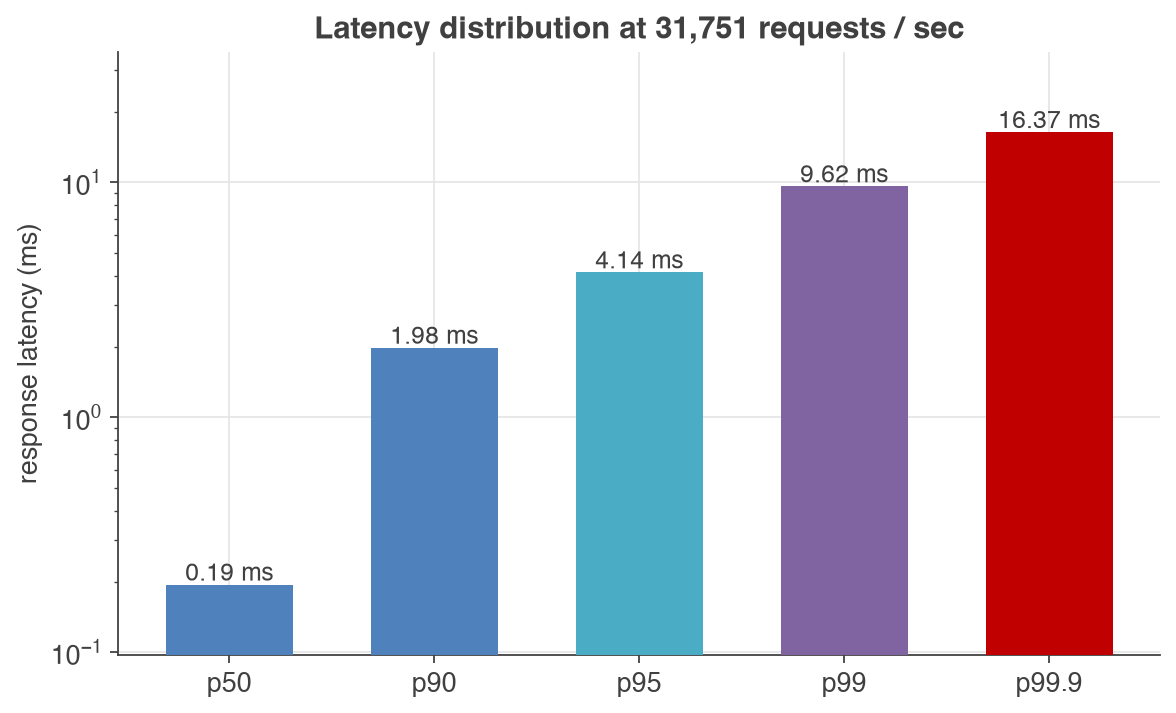
Even at the knee — around 32,000 requests/sec — the latency tail stays tight: a 0.19 ms median, a p95 of about 4 ms and a p99 under 10 ms.
The same actions measured over HTTP/1.1 and over HTTPS with HTTP/2 show that TLS and HTTP/2 add only a fraction of a millisecond — even a forwarded request or a large templated response stays within single-digit milliseconds:
What makes MockServer scale
The throughput and latency above come from a few deliberate design choices:
- Netty — an asynchronous, event-driven network framework. A small pool of event-loop threads handles many thousands of concurrent connections without a thread per request, which is what keeps latency flat as load rises. Where the OS supports it, MockServer uses Netty's native epoll transport for lower per-request overhead than the portable NIO transport.
- Candidate-matching index — instead of testing a request against every expectation in turn (an O(n) scan), MockServer indexes expectations so each request is compared only against a small candidate set. This is why matching cost stays nearly flat as expectations grow (chart above). It falls back to a scan only for expectations that cannot be indexed (for example, fully regex-based paths).
- LMAX Disruptor — a high-performance inter-thread messaging library used to record events (request log, recorded requests) and logging off the request path, so capturing state does not block responses.
- Forward-proxy connection pooling — when MockServer forwards or proxies requests upstream, connections are pooled and reused, avoiding per-request connection setup and ephemeral-port exhaustion under sustained forward load.
- Fail-fast matchers — request matching short-circuits on the first non-match, so non-matching expectations are rejected as cheaply as possible.
- Bounded in-memory log — the request/event log is a fixed-size ring buffer (maxLogEntries), so memory stays bounded under sustained load. For long-running, high-throughput instances this is the most important thing to tune — see memory & troubleshooting below.
- ScheduledThreadPoolExecutor — response delays are scheduled rather than blocking a thread, so simulated latency does not consume the event-loop threads.
Most of these are configurable — thread-pool sizes, native transport, and matcher behaviour are covered under scalability configuration below.
How MockServer is performance tested
The numbers on this page are produced by a performance suite (mockserver-performance-test/) built around k6 for load generation and the JMH microbenchmark harness for component-level measurement. A few principles make the results trustworthy:
- Open-model load (no coordinated omission). Load is generated at a fixed arrival rate rather than by a fixed number of looping clients. This avoids coordinated omission — the measurement artefact where slow responses hide further slow responses — so the reported latency is what a real caller would experience under that offered load.
- A ladder of test types, each answering a different question:
- load — steady throughput at a target rate; the CI pass/fail gate.
- sweep — steps the arrival rate up a ladder to find the throughput/latency knee (the first chart).
- stress — pushes past the knee to find the breaking point.
- soak — sustained load over time to surface memory growth, GC pressure and leaks.
- regression / growth — fixed-rate latency per behaviour (match, forward, template, large body) over HTTP and HTTPS+HTTP/2, plus a check that latency and memory do not creep upward over a run.
- microbenchmarks — JMH measurement of matching time and allocation per request, including the candidate-index scaling sweep.
- Reproducible and core-pinned. Measurement runs on a dedicated CI machine with the server, upstream and load generator pinned to separate CPU cores so they do not steal cycles from each other — the single biggest factor in number quality. Every chart is regenerated from the pipeline's JSON output.
- Automated regression detection. Each run is stored and compared against a rolling baseline using a robust median + MAD test, so a real slowdown is flagged without false alarms from run-to-run noise.
Measurement environment for the figures on this page: a single MockServer instance (current snapshot build) pinned to six CPU cores on a dedicated CI host, running the low-pause ZGC garbage collector with an 8 GB heap and full request logging enabled (the default — every request is recorded for later verification). The load generator runs on separate cores so it never steals cycles from the server. Real-world throughput and latency depend on your hardware, core count, payload size, expectation complexity and JVM/configuration tuning — more CPU cores and disabling request logging both raise peak throughput — so treat these as a solid reference and benchmark your own workload.
Detailed results
Throughput vs latency
Offered request rate against achieved throughput and response-latency percentiles for a single instance matching a simple expectation:
| offered req/s | achieved req/s | p50 | p95 | p99 | errors |
| 2,000 | 1,995 | 0.17 | 0.26 | 0.39 | 0% |
| 4,000 | 3,991 | 0.18 | 0.29 | 0.40 | 0% |
| 8,000 | 8,000 | 0.15 | 0.22 | 0.29 | 0% |
| 16,000 | 16,000 | 0.16 | 0.28 | 0.50 | 0% |
| 32,000 | 31,751 | 0.19 | 4.14 | 9.62 | 0% |
| 48,000 | 36,324 | 23.12 | 125.14 | 195.66 | 0% |
| 64,000 | 30,871 | 97.36 | 170.66 | 230.51 | 0% |
| 80,000 | 33,041 | 112.65 | 181.17 | 262.94 | 0% |
Latencies are in milliseconds. Achieved throughput tracks the offered rate up to about 32,000 req/s; beyond that the six-core instance saturates near 36,000 req/s and latency climbs predictably rather than collapsing. (More CPU cores raise the ceiling; this run pins the server to six.)
These figures are per instance. The ~36,000 req/s saturation point is the throughput of a single six-core instance — you scale beyond it by adding instances. Scaling beyond one instance: for more serving capacity (handling more inbound mock traffic) or high availability, run several instances as a cluster behind a load balancer — see Centralised Deployment. To drive more load injection (generating more outbound traffic with Load Scenarios), run injector instances in parallel — see Load Injection Performance, which measures how injected throughput scales near-linearly with the number of instances.
Matcher scaling (time per request match)
Microbenchmark of a single request match against a growing set of literal expectations, worst case (no match, so every candidate is examined): MockServer's candidate index versus a naive linear scan.
| expectations | linear scan | candidate index (default) | speed-up |
| 1 | 0.34 µs | 0.35 µs | — |
| 10 | 2.3 µs | 0.21 µs | ~11× |
| 100 | 21 µs | 0.32 µs | ~67× |
| 1,000 | 218 µs | 1.5 µs | ~147× |
| 5,000 | 1,378 µs | 7.8 µs | ~177× |
Times are microseconds per match. At one expectation the index adds negligible overhead; as expectations grow it keeps matching cheap where a linear scan grows roughly linearly with the number of expectations.
Tuning for your workload
The defaults are tuned for general use. For sustained high throughput, large payloads, or long-running instances, the most effective levers are memory/log sizing and a few scalability settings — covered in detail below. The single most common cause of an instance slowing down over time is the in-memory request log filling the heap; see memory & troubleshooting.
Clustering MockServer
MockServer supports a very high request throughput from a single node. When you need high availability, horizontal scale beyond one node, or zero-downtime rolling updates, MockServer can run as a cluster so that all nodes share state.
There are two ways to cluster MockServer. For the full deployment guide — architecture diagrams, the -clustered image, Docker Compose and Helm examples, and a decision table — see Centralised Deployment.
Infinispan state backend (recommended)
The production-grade approach uses an embedded Infinispan state backend that replicates state synchronously across all nodes over JGroups. Expectations, scenario state, CRUD entity stores, and chaos profiles are visible on every node immediately after any write, and per-expectation Times match limits are enforced cluster-wide. No shared filesystem is required.
Clustering requires the mockserver-state-infinispan module on the classpath. The pre-built -clustered Docker image (mockserver/mockserver:clustered-7.3.0) bundles this module and its JGroups dependencies; the default image does not. It is enabled with three properties:
| Property | Env var | Default | Description |
|---|---|---|---|
| mockserver.stateBackend | MOCKSERVER_STATE_BACKEND | memory | Set to infinispan to enable the clustered backend (requires the mockserver-state-infinispan module). |
| mockserver.clusterEnabled | MOCKSERVER_CLUSTER_ENABLED | false | Set to true to activate the JGroups transport and state replication across nodes. |
| mockserver.clusterName | MOCKSERVER_CLUSTER_NAME | mockserver-cluster | Cluster identifier. All nodes that should share state must use the same value. |
Note: as with the file-based approach below, the request log and verification ring buffer are node-local — a verify() call only checks the node that received it. The Centralised Deployment page covers this constraint and the full Docker Compose and Kubernetes/Helm setup.
Shared filesystem (simpler alternative)
A simpler alternative that needs no extra module is to have several non-clustered nodes share their expectations through a common read-write filesystem and identical persistence configuration. State is reconciled by writing to and re-reading the shared file rather than by live replication, so propagation is eventual rather than synchronous. This suits modest fleets where a shared volume is already available.
To create a file-based MockServer cluster all instances need to:
- share a read-write file system i.e. same physical / virtual machine, NFS, AWS EFS, Azure Files, etc
- configure identical expectation initialiser and expectation persistence
- bind to a free port i.e. separate ports if on same physical / virtual machine
Each node could be configured as follows (adjusting the port as necessary):
MOCKSERVER_WATCH_INITIALIZATION_JSON=true \
MOCKSERVER_INITIALIZATION_JSON_PATH=mockserverInitialization.json \
MOCKSERVER_PERSIST_EXPECTATIONS=true \
MOCKSERVER_PERSISTED_EXPECTATIONS_PATH=mockserverInitialization.json \
java -jar ~/Downloads/mockserver-netty-7.3.0-no-dependencies.jar -serverPort 1080 -logLevel INFO
or
java \
-Dmockserver.watchInitializationJson=true \
-Dmockserver.initializationJsonPath=mockserverInitialization.json \
-Dmockserver.persistExpectations=true \
-Dmockserver.persistedExpectationsPath=mockserverInitialization.json \
-jar ~/Downloads/mockserver-netty-7.3.0-no-dependencies.jar -serverPort 1080 -logLevel INFO
Memory Tuning Guide
MockServer stores expectations and log entries in memory using ring buffers. The two most important settings that affect memory usage are maxExpectations and maxLogEntries. Each HTTP request processed by MockServer generates 2-3 log entries (the request itself, the expectation match result, and the response).
Both settings have automatic defaults based on available JVM heap space. The table below provides recommended values if you want to override the defaults for different heap sizes:
| JVM Heap Size | maxExpectations | maxLogEntries | Approx HTTP Requests Retained |
|---|---|---|---|
| 256 MB | 1,000 | 5,000 | ~1,500 - 2,500 |
| 512 MB | 2,000 | 15,000 | ~5,000 - 7,500 |
| 1 GB | 5,000 | 40,000 | ~13,000 - 20,000 |
These are conservative estimates assuming typical request/response sizes of 1-5 KB. Large request or response bodies will consume more memory per entry.
Tips for reducing memory usage:
- Reduce maxLogEntries to limit the number of stored request/response log entries
- Reduce maxExpectations if expectations contain large response bodies
- Increase JVM heap size (-Xmx) to give the garbage collector more headroom
- Use outputMemoryUsageCsv to monitor actual heap usage and tune values accordingly
Docker example with memory-constrained settings:
docker run -d --rm -p 1080:1080 \
  --env MOCKSERVER_MAX_EXPECTATIONS=1000 \
  --env MOCKSERVER_MAX_LOG_ENTRIES=5000 \
mockserver/mockserverIntroduces a delay (in milliseconds) before protocol detection on new TCP connections. This can be used to simulate slow connection establishment, such as when testing client timeout handling or connection pooling behaviour under latency.
Type: long Default: 0
Java Code:
ConfigurationProperties.connectionDelayMillis(long millis)Configuration.connectionDelay(Delay delay)System Property:
-Dmockserver.connectionDelayMillis=...Environment Variable:
MOCKSERVER_CONNECTION_DELAY_MILLIS=...Property File:
mockserver.connectionDelayMillis=...Example:
-Dmockserver.connectionDelayMillis="500"Troubleshooting: MockServer Becomes Slow or Unresponsive
If MockServer appears to freeze, hang, or become progressively slower under sustained load, the most likely cause is memory pressure from log entry accumulation. This section explains why it happens and how to fix it.
Why Does MockServer Slow Down?
Every HTTP request that MockServer processes generates 2-3 log entries that are stored in memory regardless of the configured log level. These entries record the received request, expectation match result, and response — they are always stored to support request verification. Each log entry consumes approximately 4-10 KB of heap for small request/response bodies, scaling proportionally for larger bodies. Under sustained high-throughput load, log entry allocation drives significant GC pressure:
| Request Rate | Response Body Size | Log Data Generated Per Minute |
|---|---|---|
| 1 req/s | 1 KB | ~1 MB |
| 10 req/s | 1 KB | ~12 MB |
| 10 req/s | 100 KB | ~120 MB |
| 1 req/s | 1 MB+ | ~120 MB |
Log entries are stored in a bounded circular queue (maxLogEntries), so total memory usage does not grow indefinitely. However, the constant allocation and eviction of log entries creates GC pressure. When the JVM heap fills up, the garbage collector runs more frequently and for longer, causing pauses that make MockServer appear to freeze. In extreme cases, the JVM may spend almost all of its time in garbage collection, effectively halting request processing.
Large response bodies amplify this problem significantly. A single expectation returning a 10 MB response at 1 request per second generates over 600 MB of log data per minute — far more than a default heap can handle. Even with ring buffer eviction, the JVM must allocate and then garbage-collect these large objects continuously.
Note: Expectations with large response bodies also consume heap proportionally (e.g., a 50 KB response body results in ~55-75 KB per stored expectation). If you have many expectations with large bodies, reduce maxExpectations as well.
How To Fix It
Apply one or more of the following, depending on your use case:
| Fix | When To Use | Trade-off |
|---|---|---|
| Increase JVM heap size | Always recommended for large responses or high request rates | Uses more container/host memory |
| Reduce maxLogEntries | The single most effective fix — fewer entries means less memory and less GC pressure | Fewer requests available for verification |
| Reduce maxExpectations | When expectations contain large response bodies | Fewer expectations can be stored simultaneously |
| Switch to ZGC (-XX:+UseZGC) | Heap ≥ 4 GB and matcher latency matters — typically gives single-digit-millisecond GC pauses where G1 commonly sits in the 50–200 ms range under sustained allocation | Fixed memory overhead (less attractive below ~4 GB); set -Xms and -Xmx to the same value (e.g. -Xms4g -Xmx4g) so the heap is pre-committed |
Note on GC selection: Java 17 makes ZGC production-ready in every JDK distribution MockServer supports. For deployments with deep ring buffers (high maxLogEntries) or large heaps, -XX:+UseZGC can reduce p99 matcher latency by holding stop-the-world pauses to the single-digit-millisecond range (typically 1–5 ms in Java 17's non-generational ZGC). For small-fixture deployments (a sidecar in a test pipeline), the default GC is fine — ZGC's fixed overhead isn't worth it below ~4 GB heap. In containerised deployments using ZGC, size the container memory limit at ~1.5× your -Xmx value to leave headroom for JVM overhead (code cache, metaspace, thread stacks) and Netty's direct buffer pool. Note that ZGC multi-maps the same physical pages for its coloured-pointer scheme; under some cgroup RSS-accounting modes those pages are counted multiple times against the container limit, so the process can be OOM-killed even though the actual physical footprint fits (e.g. -Xmx4g → --memory=6g). Shenandoah is not recommended — it is not available in Oracle JDK 17 and not universally available across all JDK distributions, so ZGC is the simpler choice.
Note on logLevel and disableLogging: Setting logLevel to WARN reduces diagnostic TRACE/DEBUG log entries but does not prevent request/response recording — the memory-intensive log entries (received requests, matched expectations, and responses) are always stored regardless of log level, as they are required for verification. Similarly, disableLogging only suppresses system-out output and does not reduce memory usage. To reduce memory, lower maxLogEntries or increase heap size.
Note on logLevel and matching throughput: while stored log entries are independent of log level (above), the transient per-request allocation on the matching hot path is not. At INFO, every request that scans expectations builds and logs a diagnostic “matched”/“did not match because…” message per matcher; below INFO that work — the per-matcher log entry and the human-readable “because” string assembly — is skipped entirely. For a deployment with many expectations under sustained load this is the single largest matching-path allocation, so running at WARN noticeably cuts allocation churn and GC pressure (it does not change which requests match, only whether the diagnostic narrative is produced). This is purely a throughput/GC lever; it is independent of the steady-state memory footprint controlled by maxLogEntries.
Recommended Configurations
High-throughput with small responses (e.g., API mocking at >10 req/s with <10 KB bodies):
docker run -d --rm -p 1080:1080 \
  -e MOCKSERVER_MAX_LOG_ENTRIES=5000 \
  mockserver/mockserver
Large response bodies (e.g., responses >100 KB):
docker run -d --rm -p 1080:1080 \
  -e JAVA_TOOL_OPTIONS="-Xmx1g" \
  -e MOCKSERVER_MAX_LOG_ENTRIES=1000 \
  -e MOCKSERVER_MAX_EXPECTATIONS=100 \
  mockserver/mockserver
Maximum throughput, minimal memory (verification limited to most recent requests):
docker run -d --rm -p 1080:1080 \
  -e JAVA_TOOL_OPTIONS="-Xmx512m" \
  -e MOCKSERVER_MAX_LOG_ENTRIES=100 \
  -e MOCKSERVER_LOG_LEVEL=WARN \
  mockserver/mockserver
MOCKSERVER_LOG_LEVEL=WARN drops the per-matcher diagnostic logging on the matching hot path (see the note above), which is the largest matching-path allocation when many expectations are registered. If your matchers rely heavily on regular expressions and your patterns and inputs are trusted, also add -e MOCKSERVER_REGEX_MATCHING_TIMEOUT_MILLIS=0 to evaluate regexes inline and skip the per-regex thread hand-off (this removes the catastrophic-backtracking guard — see Regex Matching Timeout).
Configuring JVM Heap Size
The MockServer Docker image caps the JVM heap at 75% of the container's memory limit (-XX:MaxRAMPercentage=75.0), so the in-memory ring buffers size off a bounded heap. Always run the container with an explicit memory limit (for example --memory=1g, or resources.limits.memory in Kubernetes) — without one the JVM sizes its heap off the host's total memory, and the default ring sizes (maxLogEntries and maxExpectations, which derive from available heap) scale up with it, so MockServer can be OOM-killed under load. This cap only applies when you have not set an explicit heap; to change it, set an explicit -Xmx via the JAVA_TOOL_OPTIONS environment variable (a different -XX:MaxRAMPercentage passed via JAVA_TOOL_OPTIONS will not take effect, because the image's entrypoint applies its own value last):
docker run -d --rm -p 1080:1080 \
  -e JAVA_TOOL_OPTIONS="-Xmx512m" \
  mockserver/mockserver
When running with docker compose:
services:
  mockServer:
    image: mockserver/mockserver
    ports:
      - "1080:1080"
    environment:
      JAVA_TOOL_OPTIONS: "-Xmx512m"
      MOCKSERVER_MAX_LOG_ENTRIES: "5000"
When running as a standalone JAR:
java -Xmx512m -jar mockserver-netty.jar -serverPort 1080Monitoring Memory Usage
To diagnose memory issues, enable CSV memory tracking:
docker run -d --rm -p 1080:1080 \
  -e MOCKSERVER_OUTPUT_MEMORY_USAGE_CSV=true \
  -e MOCKSERVER_MEMORY_USAGE_CSV_DIRECTORY=/config \
  -v $(pwd):/config \
  mockserver/mockserver
This creates a memoryUsage_<date>.csv file that records heap usage, log entry count, and expectation count over time. If you see heap usage consistently near the maximum, increase -Xmx or reduce maxLogEntries.
Proxying LLM / Large-Body Traffic Without OOM
TL;DR: enable disk capture so every exchange is durable, and set a byte budget so the in-memory log stays bounded. Memory never grows unbounded; disk holds the complete session history.
When MockServer proxies LLM traffic — tool schemas, growing conversation context, SSE chunk accumulation — individual request/response bodies can be hundreds of kilobytes each. The in-memory event log is normally bounded only by entry count (maxLogEntries), not by body size, so even a few thousand LLM exchanges can exhaust the heap.
Two complementary settings address this:
| Setting | What it does | When to use |
|---|---|---|
| maxEventLogSizeInBytes | Caps the total request+response body bytes held in memory. Once exceeded, the oldest entries are evicted (oldest-first), in addition to the entry-count bound. | Always, when proxying traffic with large bodies. Set it well under the JVM heap — for a 2 GB heap, 256 MB (268435456) is a good starting point. |
| persistRecordedRequestsToDisk | Appends every proxied exchange — full request and response — as a single NDJSON line to a file, flushed immediately. The file is the durable record: entries evicted from the in-memory window are never lost from disk. | Always paired with maxEventLogSizeInBytes. The disk write happens before any in-memory truncation, so the archive is always full-fidelity. |
Recommended combo for LLM / large-body capture:
java -Xmx2g \
  -Dmockserver.maxLogEntries=5000 \
  -Dmockserver.maxEventLogSizeInBytes=268435456 \
  -Dmockserver.persistRecordedRequestsToDisk=true \
  -Dmockserver.persistedRecordedRequestsPath=recordedRequests.ndjson \
  -jar mockserver-netty.jar -serverPort 1080
With this configuration:
- Every proxied exchange is written to recordedRequests.ndjson in full as it completes
- The in-memory log retains at most the most recent 256 MB of body bytes (plus up to 5,000 entries by count) — the dashboard shows this recent window
- Older entries evicted from memory are still on disk — nothing is lost
The mockserver-ui/scripts/launch-with-llm-capture.sh script uses exactly this combination by default (2 GB heap, 256 MB byte budget, NDJSON disk capture). Run it with a tool name to start MockServer as an HTTPS proxy capturing that tool's LLM traffic:
./mockserver-ui/scripts/launch-with-llm-capture.sh opencodeOptional secondary valve — maxLoggedBodyBytes: when set to a positive value, bodies are truncated in memory beyond that many bytes (the in-memory copy gets a x-mockserver-body-truncated: <originalLength> header). The disk write is not affected. Use this only when you want the dashboard to show abbreviated bodies — leave it at 0 (the default) when the byte-budget eviction (maxEventLogSizeInBytes) is sufficient.
Security — data at rest: the recordedRequests.ndjson archive contains the full recorded request and response bodies on disk, which for proxied LLM and API traffic can include credentials (Authorization headers, API keys) and other sensitive data. The archive honours redactSecretsInLog — enable it to mask known secret headers and configured body fields in the file just as they are masked in the dashboard. Treat the file as sensitive regardless: store it on a protected volume and delete it when you are done. The capture launcher truncates it at the start of each session (unless you pass --keep-log).
Scalability Configuration:
When enabled (the default), MockServer uses the native Linux epoll transport for higher throughput and lower latency. This is also required for transparent-proxy SO_ORIGINAL_DST resolution, which needs epoll socket channels to read the original destination address from iptables REDIRECT rules.
On non-Linux platforms (macOS, Windows) this setting has no effect — MockServer transparently falls back to the Java NIO transport regardless. Set to false to force the NIO transport on all platforms, including Linux.
This property is read at start-up only.
Type: boolean Default: true
Java Code:
ConfigurationProperties.useNativeTransport(boolean enable)System Property:
-Dmockserver.useNativeTransport=...Environment Variable:
MOCKSERVER_USE_NATIVE_TRANSPORT=...Property File:
mockserver.useNativeTransport=...Example:
-Dmockserver.useNativeTransport=trueNumber of threads for main event loop
These threads are used for fast non-blocking activities such as:
- reading and de-serialise all requests
- serialising and writing control plane responses
- adding, updating or removing expectations
- verifying requests or request sequences
- retrieving logs
Expectation actions are handled in a separate thread pool to ensure slow object or class callbacks and response / forward delays do not impact the main event loop.
Type: int Default: 5
Java Code:
ConfigurationProperties.nioEventLoopThreadCount(int count)System Property:
-Dmockserver.nioEventLoopThreadCount=...Environment Variable:
MOCKSERVER_NIO_EVENT_LOOP_THREAD_COUNT=...Property File:
mockserver.nioEventLoopThreadCount=...Example:
-Dmockserver.nioEventLoopThreadCount="5"Number of threads for the action handler thread pool
These threads are used for handling actions such as:
- serialising and writing expectation or proxied responses
- handling response delays in a non-blocking way (i.e. using a scheduler)
- executing class callbacks
- handling method / closure callbacks (using web sockets)
Type: int Default: maximum of 5 or available processors count
Java Code:
ConfigurationProperties.actionHandlerThreadCount(int count)System Property:
-Dmockserver.actionHandlerThreadCount=...Environment Variable:
MOCKSERVER_ACTION_HANDLER_THREAD_COUNT=...Property File:
mockserver.actionHandlerThreadCount=...Example:
-Dmockserver.actionHandlerThreadCount="5"Number of threads for client event loop when calling downstream
These threads are used for fast non-blocking activities such as, reading and de-serialise all requests and responses
Type: int Default: 5
Java Code:
ConfigurationProperties.clientNioEventLoopThreadCount(int count)System Property:
-Dmockserver.clientNioEventLoopThreadCount=...Environment Variable:
MOCKSERVER_CLIENT_NIO_EVENT_LOOP_THREAD_COUNT=...Property File:
mockserver.clientNioEventLoopThreadCount=...Example:
-Dmockserver.clientNioEventLoopThreadCount="5"Number of threads for each expectation with a method / closure callback (i.e. web socket client) in the org.mockserver.client.MockServerClient
This setting only effects the Java client and how requests each method / closure callbacks it can handle, the default is 5 which should be suitable except in extreme cases.
Type: int Default: 5
Java Code:
ConfigurationProperties.webSocketClientEventLoopThreadCount(int count)System Property:
-Dmockserver.webSocketClientEventLoopThreadCount=...Environment Variable:
MOCKSERVER_WEB_SOCKET_CLIENT_EVENT_LOOP_THREAD_COUNT=...Property File:
mockserver.webSocketClientEventLoopThreadCount=...Example:
-Dmockserver.webSocketClientEventLoopThreadCount="5"Maximum time allowed in milliseconds for any future to wait, for example when waiting for a response over a web socket callback.
Type: long Default: 90000
Java Code:
ConfigurationProperties.maxFutureTimeout(long milliseconds)System Property:
-Dmockserver.maxFutureTimeout=...Environment Variable:
MOCKSERVER_MAX_FUTURE_TIMEOUT=...Property File:
mockserver.maxFutureTimeout=...Example:
-Dmockserver.maxFutureTimeout="90000"If true (the default) request matchers will fail on the first non-matching field, if false request matchers will compare all fields.
Set to false when debugging matching issues to see all mismatching fields in a single log entry. See Troubleshooting Matching for a step-by-step guide.
Type: boolean Default: true
Java Code:
ConfigurationProperties.matchersFailFast(boolean enable)System Property:
-Dmockserver.matchersFailFast=...Environment Variable:
MOCKSERVER_MATCHERS_FAIL_FAST=...Property File:
mockserver.matchersFailFast=...Example:
-Dmockserver.matchersFailFast="false"The the minimum level of logs to record in the event log and to output to system out (if system out log output is not disabled). The lower the log level the more log entries will be captured, particularly at TRACE level logging.
Type: string Default: INFO
Java Code:
ConfigurationProperties.logLevel(String level)System Property:
-Dmockserver.logLevel=...Environment Variable:
MOCKSERVER_LOG_LEVEL=...Property File:
mockserver.logLevel=...The log level, which can be TRACE, DEBUG, INFO, WARN, ERROR, OFF, FINEST, FINE, INFO, WARNING, SEVERE
Example:
-Dmockserver.logLevel="DEBUG"Disable logging to the system output
Type: boolean Default: false
Java Code:
ConfigurationProperties.disableSystemOut(boolean disableSystemOut)System Property:
-Dmockserver.disableSystemOut=...Environment Variable:
MOCKSERVER_DISABLE_SYSTEM_OUT=...Property File:
mockserver.disableSystemOut=...Example:
-Dmockserver.disableSystemOut="true"Disable logging output to system out. Request/response log entries are still recorded in memory for verification.
Type: boolean Default: false
Java Code:
ConfigurationProperties.disableLogging(boolean disableLogging)System Property:
-Dmockserver.disableLogging=...Environment Variable:
MOCKSERVER_DISABLE_LOGGING=...Property File:
mockserver.disableLogging=...Example:
-Dmockserver.disableLogging="true"Maximum request body size in bytes that conversation-aware LLM matchers will parse. LLM conversation matchers (whenLatestMessageContains, whenContainsToolResultFor, etc.) parse the inbound request body as JSON to extract the message history. For deep conversation histories or large tool results, this parse step is proportional to body size.
Requests whose body exceeds this cap skip conversation-aware matching and are treated as a no-match for conversation predicates (the scenario state machine is unaffected). Increase this value only when your LLM conversations regularly include very large tool results or long message histories. Reduce it in memory-constrained environments to bound the maximum allocation per matching attempt.
Type: int Default: 1048576 (1 MiB) Range: 16384 (16 KiB) — 67108864 (64 MiB)
Java Code:
ConfigurationProperties.maxLlmConversationBodySize(int size)Configuration.maxLlmConversationBodySize(Integer size)System Property:
-Dmockserver.maxLlmConversationBodySize=...Environment Variable:
MOCKSERVER_MAX_LLM_CONVERSATION_BODY_SIZE=...Property File:
mockserver.maxLlmConversationBodySize=...Example:
-Dmockserver.maxLlmConversationBodySize="4194304"Historical benchmarks (Apache Bench & Locust, Java 13)
The results below are from an earlier benchmarking exercise and are kept for reference. They are historical and indicative — measured on an older Java 13 JVM on specific hardware using a closed-model client-count load (which is subject to coordinated omission), so they are not directly comparable with the open-model figures above. They showed an average of 1.58 ms and a p99 of 4 ms for 150 parallel clients sending 95,228 requests per second.
The scenario was four basic expectations (method, path and headers), with a GET request matching the third expectation. MockServer was run on a Java 13 JVM with:
java -Xmx500m -Dmockserver.logLevel=WARN -Dmockserver.disableLogging=true -jar ~/.m2/repository/org/mock-server/mockserver-netty/7.3.0/mockserver-netty-7.3.0-no-dependencies.jar -serverPort 1080Note: the benchmark used -Dmockserver.disableLogging=true to disable all logging and log event processing, with -Dmockserver.logLevel=WARN as a safeguard. To suppress only system-out while still recording log events for verification, use -Dmockserver.disableSystemOut=true instead.
Apache Bench results
Apache Benchmark was executed as:
ab -k -n 10000000 -c <parallel clients> http://127.0.0.1:1080/simple| parallel clients | 50% | 66% | 75% | 80% | 90% | 95% | 98% | 99% | requests/s | mean |
| 10 | 0 | 0 | 0 | 0 | 0 | 0 | 0 | 0 | 77,122 | 0.13 |
| 50 | 1 | 1 | 1 | 1 | 1 | 1 | 1 | 1 | 85,765 | 0.58 |
| 100 | 1 | 1 | 1 | 1 | 1 | 2 | 2 | 3 | 92,846 | 1.08 |
| 150 | 1 | 2 | 2 | 2 | 2 | 2 | 3 | 4 | 95,228 | 1.58 |
| 250 | 3 | 3 | 3 | 3 | 4 | 5 | 7 | 8 | 86,470 | 2.89 |
| 500 | 6 | 6 | 6 | 6 | 7 | 7 | 8 | 9 | 83,209 | 6.01 |
| 750 | 9 | 9 | 10 | 10 | 11 | 11 | 12 | 15 | 75,554 | 9.93 |
| 1000 | 11 | 12 | 13 | 13 | 14 | 16 | 17 | 21 | 75,423 | 13.26 |
| 2000 | 24 | 24 | 25 | 26 | 27 | 29 | 31 | 35 | 82,191 | 24.33 |
| 3000 | 37 | 39 | 40 | 40 | 43 | 46 | 51 | 58 | 78,171 | 38.38 |
| 4000 | 52 | 55 | 57 | 59 | 64 | 70 | 82 | 91 | 73,552 | 54.38 |
| 5000 | 65 | 67 | 70 | 71 | 75 | 79 | 90 | 102 | 74,065 | 67.51 |
| 6000 | 80 | 84 | 88 | 90 | 97 | 104 | 122 | 137 | 70,432 | 85.19 |
Locust results
Locust was executed as:
locust --loglevel=WARNING --headless --only-summary -u <parallel clients> -r 100 -t 180 --host=http://127.0.0.1:1080| parallel clients | 50% | 66% | 75% | 80% | 90% | 95% | 98% | 99% | 99.90% | 99.99% | requests/s | mean |
| 10 | 0 | 0 | 1 | 1 | 1 | 1 | 1 | 2 | 5 | 5 | 11 | 0 |
| 50 | 0 | 0 | 1 | 1 | 1 | 1 | 1 | 2 | 3 | 5 | 50 | 0 |
| 100 | 0 | 1 | 1 | 1 | 1 | 2 | 2 | 3 | 4 | 8 | 100 | 0 |
| 150 | 1 | 1 | 1 | 1 | 2 | 3 | 3 | 4 | 5 | 6 | 149 | 0 |
| 250 | 2 | 3 | 3 | 4 | 5 | 6 | 7 | 8 | 15 | 46 | 245 | 2 |
| 500 | 2 | 2 | 3 | 3 | 4 | 5 | 6 | 7 | 9 | 46 | 479 | 2 |
| 750 | 3 | 4 | 5 | 6 | 8 | 10 | 12 | 14 | 29 | 34 | 699 | 3 |
| 1000 | 3 | 4 | 6 | 6 | 8 | 10 | 13 | 16 | 36 | 52 | 909 | 3 |
| 2000 | 4 | 7 | 10 | 12 | 22 | 34 | 49 | 59 | 87 | 110 | 1626.14 | 8 |
| 3000 | 51 | 78 | 99 | 110 | 160 | 180 | 220 | 240 | 290 | 310 | 2629.92 | 54 |